Readers’ wildlife photos

February 15, 2024 • 8:15 am

Today we have an unusual group of photos from reader Rodney Graetz: an Australian landscape changing over 81 years.  His captions are indented, and you can enlarge the photos by clicking on them:

One landscape: Interpreting 81 years of Change

Repeat photography is a widely used technique for recording landscape change.  Its first use in Australia was in 1925 of a rangeland landscape (’Koonamore’) severely degraded in 1880-1910.  I illustrate the landscape changes in a 10-image sequence spanning 81 years (1936-2017).  My contribution was to digitize, enhance and align the photographic sequence, then note and interpret changes.

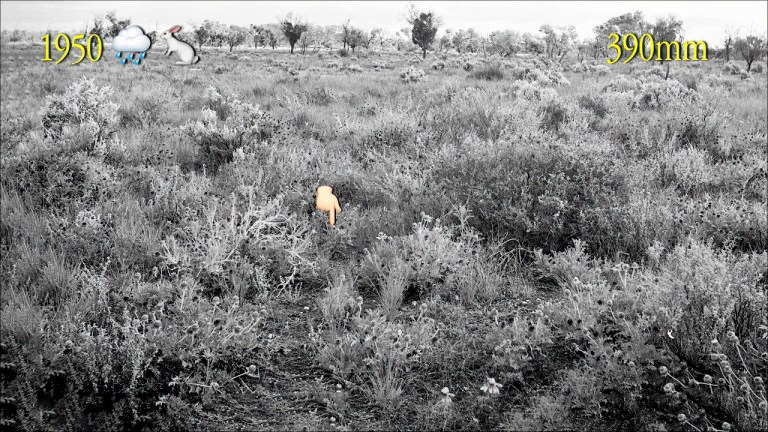
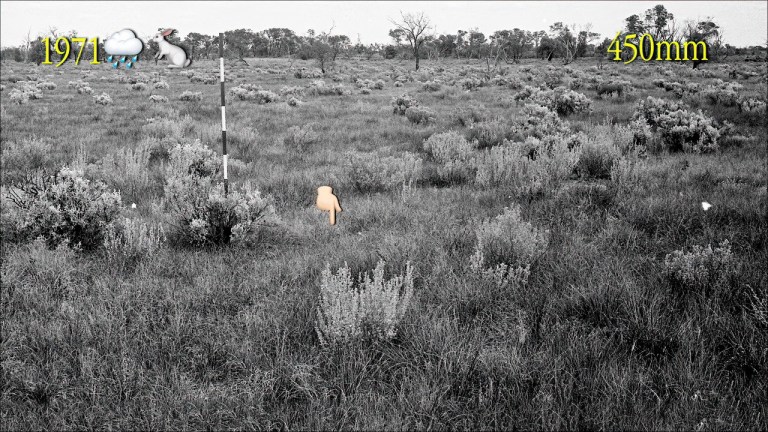
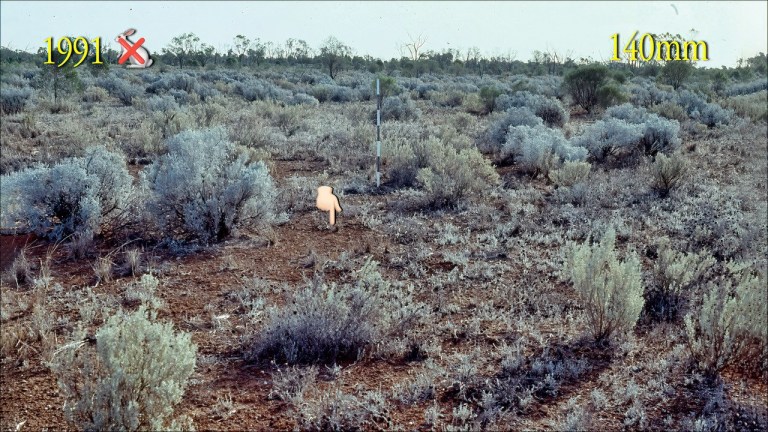
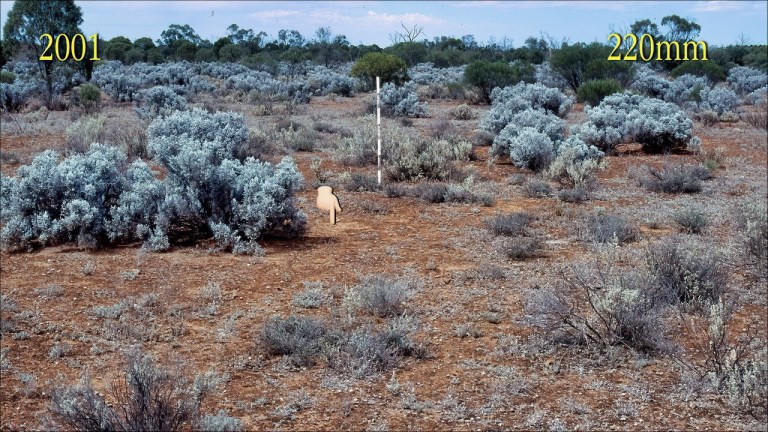
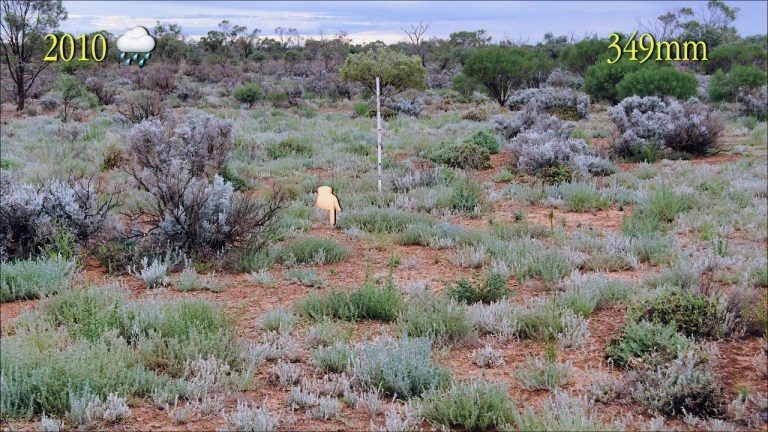
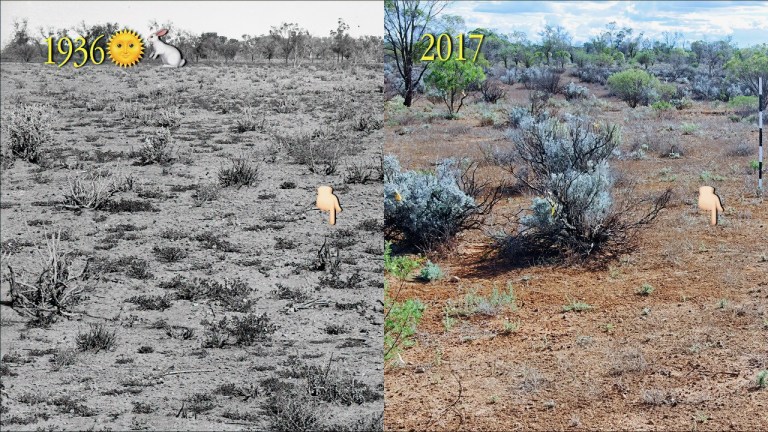
On the left hand side of each image is the year date, plus an emoticon indicating the seasonal conditions: the Sun (🌞) is below average rainfall, the Raincloud (🌧️) above average rainfall, and the rabbit (🐇) indicating high numbers.  On the right hand side, is the rainfall in the 12 months preceding the photograph: the annual average is 200 mm.  The fixed Pointing Finger is for soil surface changes:

A desolate landscape.  In the 1860s, this was once a productive and valued rangeland.  The original pasture plants were annual grasses and forbs, along with high-quality, palatable perennial shrubs.  Grazing animals generated the degradation: sheep, and principally the uncontrollable, seething plagues of the introduced European Rabbit.  The soil surface is now bare, and the clumps of sticks are the dead(?) remains of perennial shrubs.  Scattered live perennial shrubs are visible in the near background.  The question was ‘with no grazing, will this landscape recover?’  Sheep were fenced out in 1925, rabbits were eventually excluded, and kangaroo grazing was insignificant.  In 1936, the  inescapable conclusion was that after 11 years of no sheep grazing (1925-36), there were no signs of any response:

8 years on: The soil surface appears even more denuded and eroded but some of near and far shrub ‘sticks’ have resprouted a dense canopy of small leaves.  These are ‘Bluebush’, unpalatable to sheep, and a last resort for rabbits.  The resprouting was unexpected, but after 19 years of no sheep (1925-1944), but with ever-present rabbits, there appears little recovery.  Perhaps there never will be:

14 years on: The last 12 months of rainfall was double the average (200 mm/year) and the landscape response is  dramatic, regardless of the rabbit presence.  The Bluebush shrubs are now leafier, and the areas in between carry a thick stand grasses and forbs, such as the daisies in the foreground.  Now, the inescapable conclusion is that the seeds for all this new plant abundance must have been already present in the soil store and were triggered by the abnormal high rainfall:

21 years on: The dense stands of annual and ephemeral plants of the 1950 ‘wet year’ remain only as litter – fallen dead material on the soil surface.  No bare soil is visible.  This represents an ecologically significant transformation.  The litter, or mulch, changes the functioning of the crucial soil surface, transforming a bare soil surface from one hostile to both seeds and rainfall, to one increasingly receptive to both.  The uppermost layer of the soil is the incubator of all plant life:

35 years on: The viewpoint is correct, but the location of the sighting pole is not.  The previous 12 months recorded more than double the annual rainfall.  The two most obvious results are a dense standing dead layer of annual vegetation, interspersed with a number of now vigorous perennial shrubs.  Before the arrival of sheep and rabbits, shrubs were the dominant layer across this landscape:

44 years on: The viewpoint and the sighting pole are now aligned.  Colour: the landscape comes alive, and you can clearly recognise Bluebush.  The pale green shrub is Saltbush (Atriplex species) in Australia, and its cousin ‘Shadscale’ in the USA.  What was a field of dry, dead (?) sticks in 1936, is now a vista of Bluebush, with scattered Saltbush through preferential grazing.  Both sheep and rabbits prefer the (high protein) Saltbush and ignore Bluebush.  So, under with heavy grazing, ignored Bluebush eventually becomes more numerous than preferred Saltbush.  Note the first appearance of a tall green woody shrub just under the rainfall figure:

55 years on: The landscape is now visibly dominated by the two shrubs, Bluebush and Saltbush.  Saltbush has increased in number while Bluebush has increased in shrub size, but not obviously in number.  Numerous small and ephemeral plants are present that look (and are) acceptable to both sheep and rabbits, but both herbivores are now eliminated.  Under the fixed Pointing Finger, the soil is dark because it has been covered by a biological soil crust that is visible from space – see later.   The green woody shrub has grown and joined by others on the RHS:

65 years on: Bluebush shrubs continue to dominate the landscape because they have grown in size, particularly the pair closest to the Pointing Finger.  The Saltbush shrubs, right hand side foreground, have become decrepit and senescent.  The biological soil crust is now quite distinct compared with the small patch of bare soil under the Pointing Finger.  The tall green woody shrubs grow in size and number:

74 years on: Two immediate impressions.  The first is the appearance green sub-shrubs generated by an above average rainfall.  The second is that the two LHS Bluebushes, visible since 1944, now appear senescent 66 years later, as does the sea of Bluebushes in the background.  The senescing Saltbush shrubs, right hand side foreground earlier, have disappeared:

81 years on: An average rainfall year provides for a foreground almost devoid of annual plants but with a complete coverage of biological soil crust.  The 70+ year old Bluebushes on the left hand side are now senescing, as is a tall woody tree, LHS background, that first appeared in 1991.  The landscape appears quiet, even tired.  But these are not scientific descriptions:

The starkest possible contrast.  To the question ‘will this landscape recover?’, the answer is ‘Yes, with zero grazing, it will recover slowly, with rainfall-determined bursts’.

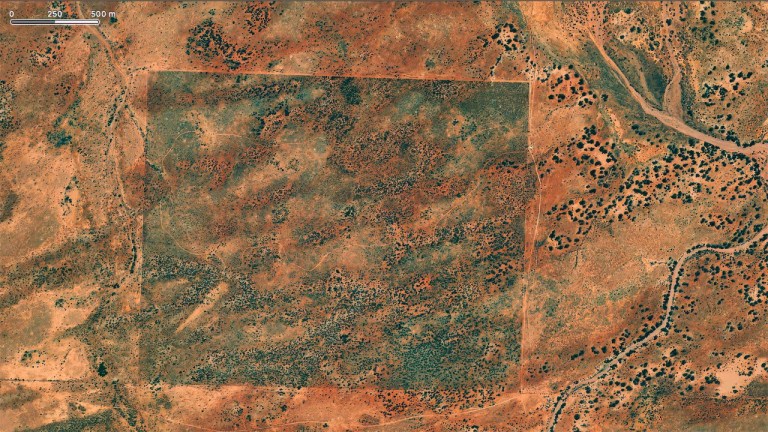
To finish: A satellite image of the Koonamore experimental site.  The entire area (400 hectares/990 acres) is a very deep brown because of the biological soil crust that developed since all sheep were removed in 1925.  Interesting!

Readers’ wildlife photos

November 25, 2023 • 8:15 am

If you’ve got photos, please send them in. I have about a week’s worth now, but in a week they’ll be gone. Thanks!

Today’s photos are contributed by reader Gregory Zonerowich, who directs the graduate program in ent0mology at Kansas State University in Manhattan, Kansas.  This series shows a controlled burn on the prairie.  Gregory’s notes are indented, and you can enlarge the photos by clicking on them.

These are all taken at the Konza Prairie Biological Station just a few miles south of Manhattan, KS. The station is 8,600 acres of tallgrass prairie and is one of the original NSF Long-Term Ecological Research sites. Only about 2-3% of tallgrass prairie remains in the US.

The station maintains a herd of bison (Bison bison) to study the effects of native grazers. The lighting was not very good for this photo but the bull had such a regal pose.

Controlled burns are a common land management practice in this region and are necessary to preserve the prairie. We start at the upwind side of a watershed with two crews moving in opposite directions. Here a torcher widens the initial buffer along the edge of burn. There may hundreds of acres involving more than one watershed during a burn. Often the two crews are out of sight so we use radios to monitor each other’s progress. Communication and coordination can be critical given the direction of the wind and the natural twists and turns of the watersheds.

Backfires are low intensity and move very slowly against the wind, sometimes only about a foot per minute.

A nice comparison of a backfire and a head fire. The backfire is low and moves slowly against the wind, the head fire moves with the wind as a tall, hot, and fast wall of flame.

Universities and government agencies such as the EPA and US Forest Service conduct various studies at the station, including fire behavior and the gases and microbes found in smoke. Here a drone is taking smoke samples.

After the two burn crews meet at the downwind side of the watershed and the watershed has been ringed by fire, the head fire moving with the wind creates a surprisingly noisy maelstrom of smoke and flames. I used to wonder how people out in the open could be caught and consumed by wildfires, but I’ve seen many head fires I could not outrun.

It’s pretty easy to get dramatic photos while out on a prairie burn.

The result of a controlled burn, blackened earth that will soon green up with new grass after a spring rain. The burns expose the rocky soil and show why much of this prairie was spared from the plow.

Two watersheds are burned during the summer of every other year, hence the very dense smoke with the sun peeking through. “Bambi” is a military surplus vehicle equipped with a large water tank to refill the 300-gallon water tanks the burn crews have on their vehicles.

I liked the contrast between the black burned prairie, the tan unburned area, and the blue sky.

I’m always fascinated by the physics that produce smoke tornados, or “ashnados”. Sometimes they are just a few inches wide at the base but they also can be several feet wide at the base. These can dangerous because they might pick up hot ash or embers and drop them into an unburned watershed, creating a wildfire. For scale, the red truck is a Ford F-350 dually with a 300-gallon water tank on the back.

This tall white ashnado was right behind the site manager.

The station has a number of creeks and seeps. They run in most years but will dry up during a drought.

For folks who may be interested in controlled burns:

Nice drone view of a prairie burn: 

Why burns benefit the prairie:

Readers’ wildlife photos

June 7, 2023 • 8:15 am

Today we have another photo-and-text story, this time on earthworms (a favorite of Darwin), concocted by Athayde Tonhasca Júnior. His captions are indented, and you can enlarge the photos by clicking on them.

Underground influencers

“Everything is connected” is the sort of vacuous New Age twaddle churned out by the self-help industry. And yet, stuff and nonsense often holds a grain of truth. For example, we would have to look hard to find a connection between earthworms and bees. But such an association exists, and it is of consequence for pollination services.

Earthworms (mainly of the family Lumbricidae, which includes most European species) are immensely important for the functioning of some terrestrial ecosystems. Their tunnels channel air, water and nutrients into deep layers of the soil, and facilitate root penetration. Their work improves soil structure and reduces runoff, thus decreasing the rates of erosion. By eating soil, plant litter and other materials (depending on the species), earthworms break down organic matter, helping decomposers such as bacteria and fungi release nutrients into the soil. Their food intake, 2 to 20 tonnes of organic matter/ha/year, ends up as castings (worm excrement), which are rich in nitrogen, phosphorus, potassium, magnesium and calcium, all minerals essential for plant growth. Thanks to their relentless burrowing, soil mixing and fertilizing, earthworms are important to soil formation, and consequently vital to plants and every organism that depends on them. You can learn a great deal more about these indefatigable diggers from The Earthworm Society of Britain.

The common earthworm (Lumbricus terrestris) © Fir0002/Flagstaffotos, Wikimedia Commons:

The value of earthworms was not lost on Charles Darwin. His 1881 book, The formation of vegetable mould, through the action of worms, published a few months before his death, was a revelation to the general public about the importance of these secretive and poorly known animals. The book was a huge success, selling 6,000 copies in the first year, more than On the Origin of Species when it was first published.

Darwin and his worms in a caricature from Punch, 1882:

Darwin calculated that in 10 years, castings from 0.4 ha (one acre) of soil would form a 5 cm-thick layer of top soil (what he called ‘vegetable mould’). In his book’s closing paragraph, Darwin justified calling earthworms ‘nature’s ploughs’: ‘The plough is one of the most ancient and most valuable of mans (sic) inventions; but long before he existed the land was in fact regularly ploughed, and still continues to be thus ploughed by earth-worms. It may be doubted whether there are many other animals which have played so important a part in the history of the world, as have these lowly organised creatures.’

Diagram of the formation of vegetable mould. Darwin, 1838. Proceedings of the Geological Society of London 2: 274-576:

Considering earthworms’ impressive portfolio as nature’s engineers, we may think they are indispensable, or useful, everywhere. But they are not.

About 10,000 years ago, northern North America was overwhelmed by a vast ice sheet. If there were earthworms in the region, they were killed by the glaciation because there were none when the ice receded. So northern North America was earthworm-free until European settlers started to bring in plants and soil, which inevitably introduced worms such as the ‘night crawler’, the local name for the common earthworm Lumbricus terrestris.

American farmers and gardeners benefited from ‘nature’s ploughs’ as much as Europeans did, but it was a matter of time until earthworms made their way to native habitats such as hardwood forests. And in those environments, earthworms were not welcome at all.

The top layer of the forest floor – known as the litter layer – consists of leaves, bark and stems at different stages of decomposition. In North American native forests, the litter layer is broken down slowly, mainly by millipedes and mites. Organic material accumulates as blanket sheets, which are essential habitats for many insects, amphibians, birds, and flowers.

Deep litter mound at the base of a pine tree © Hood, USDA Forest Service.:

When earthworms move in, the litter layer is consumed in two shakes of a duck’s tail. Decomposition accelerates dramatically, so that nutrients that have been slowly accumulating are released quickly; plants cannot absorb them all. With the loss of litter cover and nutrients, the understory fauna and flora become depleted. Dwindling understory plant biomass has secondary consequences; deer will have no option but to munch on young trees, and non-native plants may take advantage of the impoverished conditions to spread out. These problems worsened after the arrival of the Asian jumping worm (Amynthas agrestis), an earthworm native to Japan and Korea.

But the negative impact of earthworms is not restricted to the litter layer. In Canada, the abundance, biomass, and species richness of the insect fauna above ground are lower in forest plots with invasive earthworms than in earthworm-free areas. Insect abundance was reduced by 61% where earthworm biomass was highest (Jochum et al., 2022).

Effects of earthworm-invasion status on herbivore richness (morphospecies), left; biomass (mg/m2), centre; and abundance (log10 individuals/m2), right, in Alberta, Canada © Jochum et al., 2022:

The reasons for these effects are not known. Scarcity of some plants or altered soil conditions in earthworm areas may reduce the abundance and survival of herbivore and soil-dwelling invertebrates, which may affect the food chain. Invasive earthworms can decrease the concentrations of some plant metabolites used against leaf-chewing insects, so changes in plant chemistry may be involved.

Would this hoverfly be affected by the works of earthworms? Probably yes © Forest Wander, Wikimedia Commons:

Even more worryingly, there is strong evidence that earthworm activity increases emissions of greenhouse gases. Dendrobaena octaedra, another earthworm native to Europe, seems to be spreading in Canadian boreal forests, which are important carbon reservoirs. Wherever this earthworm is found, some of the carbon stock in the forest floor is lost in the form of carbon dioxide. So many soil ecologists have rightly voiced their concerns about a ‘global worming’.

A schematic illustration of invasive earthworm effects on ecosystems that were free of earthworms (left figure) © Ferlian et al., 2017:


The shenanigans of Darwin’s ‘nature’s ploughs’ in northern North America are cautionary tales about species taken to where they do not belong. Few could have expected that earthworms, so beneficial to species and habitats in the Old Continent, are detrimental elsewhere. The buff-tailed bumble bee (Bombus terrestris) and the European honey bee (Apis mellifera) are protagonists of similar tales.

The unpredictability of outcomes is a concern. Only a fraction of invasive species are harmful, but those that are can be disastrous.

Kudzu (Pueraria spp.), ‘the vine that ate the South’, was purposely introduced into the United States for erosion control, but became an environmental nightmare. It is spreading at an estimated rate of 610 km2/year © Scott Ehardt, Wikimedia Commons:


JAC Addition:  Here I’m posing (in 2008) with Darwin’s “wormstone” at Down House, his home in Kent. As Darwin Online notes, Darwin used this to “measure the rate of sinking of the stone due to the actions of earthworms.” The site adds, “The stone now at Down House was reconstructed by Horace Darwin’s Cambridge Instrument Company in 1929 when Down House became a museum open to the public.”

Change the language of ecology and evolutionary biology! An example from sickle-cell anemia.

March 8, 2023 • 9:00 am

I may have mentioned this article from Trends in Ecology & Evolution before, as it outlines all the possible harms that the language of ecology and evolutionary biology (EEB) can cause. Click to read:

Here’s one bit:

In recent years, events such as the coronavirus disease 2019 (COVID-19) pandemic and waves of anti-Black violence have highlighted the need for leaders in EEB to adopt inclusive and equitable practices in research, collaboration, teaching, and mentoring.

As we plan for a more inclusive future, we must also grapple with the exclusionary history of EEB. Much of Western science is rooted in colonialism, white supremacy, and patriarchy, and these power structures continue to permeate our scientific culture.

Here, we discuss one crucial way to address this history and make EEB more inclusive for marginalized communities: our choice of scientific terminology.

By now you should be familiar with this kind of writing, which can be simply copied from one scientific field practicum to another. Chemistry and physics have their own papers calling for a new inclusive terminology, too.

And once again we see the unproven assertion that the “colonialist, white supremacist, and patriarchal” nature of EEB has excluded minorities, and also that the language of the field practicum has been partly responsible for that exclusion.

This is doubly fallacious. It is neither the nature nor the language of science that has kept minorities out of the EEB pipeline, but racism in the past, bigotry whose effects have never been repaired, creating a longstanding underclass. It is change in the nature of society, not in the nature of science, that will create the equal opportunity allowing oppressed people access to careers in science.

And frankly, I consider the claim that the language of our field has contributed to that exclusion a risible proposition. “Field”, for example, which refers to an area of study, has been deemed racist because it harkens back to the days of the plantation. The folks at Stanford have decreed that it’s to be replaced by “practicum.” Thus the age-old ecological tradition of “fieldwork” is now supposed to be “my practicum of studying ecology in the outdoors.” That suggestion would be hilarious if it weren’t true.

Further, the journal American Naturalist has suggested that EEB is ridden with ableist terms, including the population-genetic concept of “fitness”. (By the way, that is my most-viewed post of all time, with nearly 150,000 views.) If any disabled person has been kept out of EEB by this term, or any others, I’d like to know about it, for of course this article gives no such instances.

The article above links to a fill-in form in which you can suggest your own inclusive or innocuous term to replace harmful ones.  Go to this page by clicking on the screenshot:

This is part of “The EEB Language Project,”  which aims to increase equity in the field practicum by changing words. You are invited to note your own “harmful term”, suggest a more inclusive replacement term, and then give comments. In this way the language of EEB will be Newspeaked into equity.

Now despite the patronizing nature of this project, much less its futility, it’s amusing for those of us in EEB to think of such terms. A colleague and I came up with half a dozen in just five minutes. Here’s one that, I’m sure, has stifled diversity in the field greatly. But to explain it, I must give a biology lesson.

Harmful term:  “Heterozyote advantage”.

What it means: This is an example of where the genetic constitution at a single locus (chromosome site) is such that the heterozygote, containing two different gene forms, has a “fitness advantage” (substitute your own less ableist language) over either of the two homozygotes.  The classic example (and one of the few we know of) involves the genetic disease sickle-cell anemia.

There are two forms at this gene, which produces the beta chain of hemoglobin: “S“, the so-called “normal allele” (substitute more inclusive language), and the mutant form (you can say “alternative allele”) s, responsible for causing the debilitating disease sickle-cell anemia.

The “s” allele arose when a mutation in the DNA coding for the beta chain (in the genetic code, GAG—>GTG), changed the amino acid in position six of the Hb β chain from glutamic acid to valine. That changes the charge of the hemoglobin molecule, affecting its behavior in the presence of the parasite. If you have only one copy of the mutant form (allele), ergo are a heterozygote with the genetic constitution Ss, you produce half normal and half abnormal hemoglobin, but half is good enough to allow you good health. And if you have two copies of the normal allele (SS), you’re of course also fine.

But if you have two copies of the sickle-cell allele (ss); you get sickle-cell disease, and will have a painful illness and in all probability die young.

The twist in this story is that if you are a heterozygote in West Africa, where malaria is prevalent and often fatal, the heterozygote has both good health and protection against malaria compared to the normal and abnormal “homozygotes”, SS and ss. We’re not sure why this is, but the presence of the single sickle-cell allele in a carrier makes its blood cells break open prematurely when infected by the malarial parasite. This impedes reproduction of the sporozoan parasite that causes malaria so Ss “carriers” gain some protection against the infectious disease. Normal homozygotes (SS) have blood cells that rupture on schedule, so if you’re SS, you can get malaria and die.

Thus we have a situation, but only in areas with malaria, where the normal homozygote is healthy but prone to malaria, the sickle-cell homozygote (ss) gets the genetic disease and dies young, but the heterozygote (Ss) is protected from both malaria and from sickle-cell disease. This is the classic case of heterozygote advantage (also called “heterosis”, “balanced polymorphism,” or “overdominance”).

If you measure the relative reproductive output of the three genotypes, giving the fittest one (Ss) a fitness of 1.0, you get these figures

SS = 0.85 (they produce 15% fewer offspring than Ss genotypes because of malaria)

Ss = 1.0. (genotype with highest production of offspring)

ss = about 0 (they don’t survive to produce any offspring).

Geneticists love this case because when the heterozygotes have the highest fitness, it actually maintains both alleles at stable frequencies in the population. Heterozygote advantage is a way to keep genetic variation in a malaria-ridden population. You can show that this fitness scheme will result in stable equilibrium allele frequencies of S = 0.87 and s = 0.13. As I said, this is a stable frequency, and if the gene frequencies deviate from it, they will return to the equilibrium.

In west Africa, the frequencies of the two alleles in fact match these predicted frequencies very well, supporting the value of mathematical population genetics. The frequency of homozygous ss individuals is the square of the frequency of the s allele, or about 1.7%.  It is a sad but ineluctable result of population genetics that because heterozygotes are the fittest genotypes, roughly 2% of the offspring will be born with a fatal disease, and this is simply because the individual with two different alleles has the highest fitness. There is no single allele whose homozygote has the highest fitness, and so, generation after generation, this fitness scheme above produces a large number of doomed infants. (One could take the absence of such an allele as evidence against God, who could have created one. Apparently the death of genetically diseased infants serves some purpose in the deity’s scheme.)

In the U.S., where malaria is almost unknown, the fitness scheme above reverts to one in which the SS genotype has the highest fitness, Ss is a tiny bit lower (Ss individuals can have occasional sickling “crises”), and that of ss remains zero. Eventually, in areas lacking malaria, every individual will become SS and the “s” allele will be eliminated.

It is because of the ancestry of many American blacks from West Africa that one sees sickle-cell anemia almost exclusively in the offspring of two individuals descended from that area (Ss X Ss, one-quarter of whose offspring will have the disease). But in the U.S., lacking malaria, natural selection will eventually eliminate the “s” allele. It will, however, be very slow.

One last note: sickle-cell anemia was the first “molecular disease” ever discovered: a disease caused by a mutation in a single gene that alters the protein it produces. And it was discovered by none other than Linus Pauling and his colleagues, who published this famous paper in Science in 1949 (click screenshot to read, or go here if you’re paywalled).

Now, on to the language issue:

Why the term “heterozygote advantage” is harmful. You notice in the above discussion I’ve used several verboten terms in EEB, including “normal allele”, “mutant allele”, and “fitness.”

To that I will add the term “heterozygote advantage” itself, which is harmful in two ways. First, the term “hetero” privileges heterosexual individuals over other LGBTQ+ individuals. And the idea that Ss individuals have a “fitness advantage” is doubly harmful, for it not only incorporates the ableist term “fitness,” but suggests that one genotype has an “advantage” over the other two. In reality, the SS and ss individuals are to be seen as “differently abled”, although I can’t manage to find a way that ss individuals with sickle-cell disease are “abled”. Some deep thought may suggest a way.

What the term should be replaced with.  This is dead obvious: “diversity advantage“.  The Ss genotype is best because it has the most diverse allelic constitution, possessing two alleles instead of one.  It privileges diversity over boring homogeneity, a result that is also a bonus.

From now on I suggest that my new term, which is mine, replace “balanced polymorphism,” “heterozygote advantage” (ableist), “overdominance” (that’s wholly offensive, conjuring up eugenics and superiority), and “heterosis” (again with the offensive “hetero”).

This is my contribution to inclusive language in EEB, which is mine. Lest you think the suggestion is dumb, remember that it’s no dumber than the notions of “relative fitness” and “fieldwork”, all slated for erasure in the new woke dictionary of EEB.

Readers’ wildlife photos

January 2, 2023 • 8:15 am

Today we have the first contribution of the year by Athayde Tonhasca Júnior: one of his patented word-and-photo stories. His text is indented, and you can enlarge his photos by clicking on them.

How beauteous mankind is! O brave new world,
That has such people in’t.

—William Shakespeare, The Tempest

1

Mr McGuire: I want to say one word to you. Just one word.
Benjamin: Yes, sir.
Mr McGuire: Are you listening?
Benjamin: Yes, I am.
Mr McGuire: Plastics.

Mr McGuire was prescient in his advice to young Benjamin Braddock about his career options (The Graduate, 1967): the plastics industry has since expanded to levels unimaginable then. Cheap, versatile, resistant and durable, plastic products are essential in today’s society. They are everywhere. So, unsurprisingly, they are an ever growing environmental problem: land, waterways and the oceans are stuffed with discarded plastic.

Plastic rubbish is a blight on the landscape, but some birds and mammals have taken advantage of this abundance of material. Squirrels and opossums have learned to use straws, string and plastic bags for nest building; plastic fragments were present in about 14% of surveyed nests of the brown booby (Sula leucogaster), a seabird found around the world. So, diligent nest builders such as leaf-cutter bees (genus Megachile) were bound to join this team of opportunists.

Most leaf-cutter bees cut pieces of leaves or petals to build their nests; some use mud, pebbles or resin as construction materials. These bees usually nest in sheltered natural cavities such as burrows, crevices and hollow twigs. They are important pollinators, and a few species have been reared commercially for crop production, such as the alfalfa leaf-cutter bee (Megachile rotundata).

A Megachile centuncularis at work. This is one of seven megachilid bees in Britain © Line Sabroe Wikimedia Commons:

A leaf-cutter bee nest © Subbu Subramanya, Wikimedia Commons:

In Ontario, Canada, alfalfa leaf-cutter bees have been creative and resourceful by using pieces of polyethylene-based shopping bags as a building material. Another local species, the bellflower resin bee (Megachile campanulae), constructs nests with plant resins instead of leaf and stem segments. It has no use for plastic bags, but polyurethane-based sealants, which are applied to the exteriors of buildings, offer a handy and abundant alternative. Some bellflower resin bees mixed this plastic product with natural resins to build their nests.

Brood cells partially constructed with polyethylene plastic bag fragments (L,) and polyethylene resin © MacIvor & Moore, 2013. Ecosphere 4: 1-6

Rural areas are not exempt from the plastic deluge. In the Argentinian countryside, bits of greenhouse covers, agrochemical containers, fertilizer bags and irrigation hoses combine with the ubiquitous shopping bags to deface the landscape. One bee, possibly an alfalfa leaf-cutter bee, took advantage of this clutter to do away with leaves or petals completely: she built an entire nest with pieces of two types of plastic.

A plastic nest of Megachile sp. built in a nest trap © Allasino et al., 2019. Apidologie 50: 230–233:

We don’t know whether plastics have any effect on leaf-cutter bees. They may be neutral, or even beneficial; plastics may act as a barrier against fungi and parasites, which are important mortality factors for solitary bees. On the other hand, these impermeable materials may trap water and thus increase the brood’s susceptibility to diseases.

By using plastics, bees have demonstrated their ability to identify alternative and convenient resources, and to adjust to changes in their environment. All the same, plastic nests are another troubling sign of a world living in the Anthropocene. From the Greek anthropos (man) and cene (new or recent), this unofficially labelled geological epoch applies to Earth’s history since humans started to have a significant impact on climate and ecosystems. It’s a new world of mass extinctions, deforestation, pollution, fossil fuels, and climate change. Perhaps leaf-cutter bees can adapt and even flourish in this world. We may do the same. Or not.

2

In 1926, the British government’s Central Electricity Board set out to create a nationwide electrical grid to bring cheap power for everyone. This was the biggest building project that Britain had ever seen, and soon steel pylons and transmission lines began popping up all over the landscape. And many people didn’t like what they saw. In 1929, Rudyard Kipling and John Maynard Keynes co-signed a letter to The Times objecting the construction of pylons, noting they were ‘the permanent disfigurement of a familiar feature of the English landscape.’ The pylon’s designer, architect Sir Reginald Blomfield, fired back: ‘Anyone who has seen these strange masts and lines striding across the country, ignoring all obstacles in their strenuous march, can realise without a great effort of imagination that [they] have an element of romance of their own. The wise man does not tilt at windmills – one may not like it, but the world moves on.’

You may side with Kipling and Keynes or Blomfield in this aesthetics vs utility debate, but transmission lines are here to stay, for a while at least. The British grid of high-voltage lines from power stations alone runs for ~25,000 km; adding to that several thousand kilometres of regional networks, power lines have become part of our landscape.

Transmission corridors, similar to roadsides and railway embankments, are routinely mowed, clear-cut or treated with herbicides to prevent the encroachment of trees and dense vegetation. These practices are viewed as necessary evils by the public and some conservationists; but, with the right touch, they create opportunities for bees and other pollinators.

In ecology, ‘succession’ is the process by which a natural area changes after a disturbance or following the initial colonization of a new place. In terrestrial habitats, early succession refers to the period before they become enclosed by trees’ canopy. Weedy areas, grasslands, old fields or pastures, shrub thickets and young forests are all examples of early successional habitats. And so are transmission corridors, where maintenance crews prevent succession from reaching its equilibrium point or climax by cutting down the vegetation.

Plant succession © CNX OpenStax, Wikimedia Commons:

It turns out that habitats in the early successional stages are excellent for bees. These areas offer a steady supply of nectar and pollen over much of the year, as opposed to forested areas where blooms peak in spring and are limited by the shaded canopy from midsummer on. The large majority of bee species nest in the ground; they need patches of bare soil of the right texture and moisture levels, and close to their food plants. Successional habitats are just the right place for this combination of features. So it’s not surprising that bee abundance and species richness decreases with increasing forest cover.

Lots of flowers, nesting/hibernation sites & sunshine: perfect for bees © Mick Garratt, Wikimedia Commons:

In the north-eastern United States, energy companies have been maintaining power lines under Integrated Vegetation Management (IVM) since the 1950s with the objective of protecting the grid while providing habitat for threatened plants and animals. It sounds fancy, but essentially IVM comprises five-year cycles of selectively killing trees (mechanically or with herbicides), with no mowing or widespread spraying of herbicides. These simple techniques create a mosaic of meadow, herbaceous plants and shrubs, which have proved to be good for many reptiles, amphibians, birds, small mammals, and bees. A comprehensive survey along 140 km of a transmission line in New England revealed that the sunny, open corridors held nearly 10 times the number of bees and twice the number of bee species as compared to adjacent forested areas. Not only that, about half the known species for the region, including some rarities, were found in the survey (Wagner et al., 2019.  Biological Conservation 235: 147-156).

A power line corridor, great habitat for bees © Mark Nenadov, Wikimedia Commonns:

Not everybody likes the sight of a transmission line. But these ugly and gloomy steel towers and cables can be turned into pollinator and wildlife havens. All it takes is goodwill and some imaginative work. The lights will stay on, and there will more bees around.

3

The Milky Way galaxy has awed civilizations and inspired many philosophical thoughts about mankind’s insignificance, our place in the big scheme of things, the fleeting nature of life, and what it’s all about. But if young Europeans or Americans are asked to share their impressions about the Milky Way, responses are likely to be limited to a shrug or a puzzled look: about 60% of Europeans and 80% of North Americans have never seen it. When Los Angeles went through a blackout in 1994 because of an earthquake, emergency services received several calls from nervous citizens about a giant, strange, silvery cloud in the dark sky. These Angelinos were seeing the Milky Way for the first time.

The Milky Way, unseen by many © Oliver Griebl, Wikimedia Commons:

As the human population increases and concentrates more and more in cities, the world becomes more illuminated. Artificial light at night (ALAN) is an ever-growing phenomenon because of the lighting of streets, parking lots, roads, buildings, parks, monuments, airports, stadiums – basically any manmade structure. This artificial light is scattered into the atmosphere and reflected back, particularly by clouds, creating a nighttime sky luminance known as ‘sky glow’. Excessive illumination and artificial sky glow spread way beyond urbanized areas, essentially contaminating the whole landscape with light: nighttime darkness is disappearing.

Glow in the sky from Helsinki seen in Estonia © Bilovitskiy, Wikimedia Commons:

Light pollution is an ecological disturbance with multiple consequences. ALAN disrupts natural day-to-night rhythms such as singing and migration of birds, the activity period of small mammals, mating of frogs, nesting of bats and the orientation of sea turtle hatchlings. There is increasing evidence that humans are also sensitive to ALAN: it affects our circadian rhythm (the sleep–wake cycle repeated approximately every 24 hours), resulting in irregular hormone production, depression, insomnia and other maladies.

Insects couldn’t be immune to the effects of ALAN since much of their behaviour is dependent on light. We don’t know how insects see the world, but they recognize forms, detect movements and discern colours based on lighting patterns. Insects can monitor the position of the sun by the polarization of light, so they can navigate with precision. Light detection helps them to keep track of the photoperiod (day length), which is fundamental to preparing for the winter months.

Many beetles, flies, lacewings, aphids, dragonflies, caddisflies, wasps and crickets are drawn to light, but moths’ compulsive and apparently suicidal attraction to lightbulbs or flames is the most familiar case of positive phototaxis (moving towards a light source) among insects. Moths are important pollinators, so naturally their possible vulnerability to killer lights is a matter of concern.

A fatal attraction © Fir0002, Wikimedia Commons:

It turns out that moths’ fatal attraction doesn’t seem to be that fatal because they are only drawn to light at relatively short distances. A few moths come to a blazing end, but most of them are beyond light’s dangerous pull. This is not to say that moths are safe from ALAN. When the night is not sufficiently dark, egg-laying and production of sex pheromones are inhibited for some species, so that their reproduction is affected. Also, the window of time for courtship and mating can be severely reduced. Light pollution interferes with moths’ perception of colours and shapes, signals necessary for flower location. It also makes them more vulnerable to parasites and predators, either because they are easier to find, or their defence mechanisms (e.g., bat avoidance manoeuvres) are less effective in over-illuminated environments.

Light pollution disturbs many aspects of moths’ physiology and behaviour, although we can’t tell whether whole populations are being harmed: not all species respond equally, and there are many variables to be considered about the light source, such as wavelength, intensity, polarization and flicker. But from the little we know, excessive illumination can be added to the list of pressures on our moth fauna and consequently on pollination services.

At a time of growing concern about global warming, light pollution may sound like a secondary problem. But the more researchers look into it, the more they learn that this is a serious environmental threat. And while sorting out the climatic mess will be tricky and complex, the light pollution problem is relatively easy. The first, obvious and straightforward measure is to turn off unnecessary lights. When illumination is needed, it could be dimmed, shielded or limited to specific areas such as pavements or roads. Light dimming is good for the environment and for the economy too. When in 2018 the city of Tucson, USA, converted nearly 20,000 of their street lights to dimmable LEDs, £1.4m were saved from its annual energy bill.

Preserving and protecting the nighttime environment is an important but neglected aspect of conservation. A darker world would benefit moths and other species, and it would be good for us as well. We could sleep better or go stargazing again.

World map of light pollution: colours show intensities of sky glow from artificial light sources © David Lorenz, Wikimedia Commons:

Ancient ecosystem reconstructed using fossil DNA

December 9, 2022 • 10:30 am

The oldest DNA sequenced up to now was from a mammoth molar preserved in permafrost, and was dated about 1.2 million years ago. Now a group of scientists, excavating a 100-meter-thick layer of frozen soil in the “polar desert” of northern Greenland, not only found short stretches of DNA that identified the plants, animals, and algae present a long time ago, but also showed that that the time was at least two million years ago.

This is the oldest fossil DNA ever sequenced; it was preserved because it had been adsorbed to minerals in frozen soil. And although the stretches of DNA had degraded into short bits—about 50 base pairs long—they were sufficiently similar to modern taxa that they could identify the groups from which they came. In fact, they could reconstruct the whole ecosystem of that area 2 million years ago. It was much richer in flora and fauna than today’s polar desert, for at that time Greenland wasn’t covered with ice, it was much warmer (mean summer temperature about 10°C), and organisms could migrate to Greenland over land bridges. This might give us a hint of what kind of ecosystem could develop (minus the animals, which are largely gone) should global warming melt the ice presently in Greenland.

You can read the Nature paper for free by clicking on the screenshot below (the pdf is here, reference at the bottom). Below that is a clickable and short popular account of the findings, also published in Nature.

The News article for tyros (short; click to read):

Here’s the location of the area analyzed in northern Greenland, Kap København, where the layer of soil occurred (yellow star). The layer’s presence was already known, and some of the samples had been dug up in 2006 and had been sitting in a Copenhagen freezer for 16 years. Somebody had a bright idea to see if they could identify and sequence the DNA in that soil, and it worked!

(from the paper): a. Location of Kap København Formation in North Greenland at the entrance to the Independence Fjord (82° 24′ N 22° 12′ W) and locations of other Arctic Plio-Pleistocene fossil-bearing sites (red dots). b, Spatial distribution of the erosional remnants of the 100-m thick succession of shallow marine near-shore sediments between Mudderbugt and the low mountains towards the north (a + b refers to location 74a and 74b).

Small stretches of DNA were sequenced and compared to modern DNA as well as DNA inferred in ancestors of modern taxa. The DNA had of course degraded, but they found stretches about 50 base pairs long. Comparisons were mostly to mitochondrial DNA for animals and to conserved chloroplast or other plastid DNA from plants. (They also found ancient pollen that they used in conjunction with the DNA data.)

On the right you can see what animals were found, mostly identified to genus or family because there wasn’t enough DNA to do a finer analysis. I’ll put a list of what they found below this figure:

(from paper): Taxonomic profiles of the animal assemblage from units B1, B2 and B3. Taxa in bold are genera only found as DNA

Here’s what they found from the DNA; these were all organisms living roughly at the same time about 2 million years ago. And remember, that area now harbors very little life.

A mastodon! The figure below shows its placement on the phylogenetic tree of elephants.

70 genera of vascular plants, including sedges, horsetails, willows, hawthorns, spruce, poplars, yew, and birch. Some of these no longer grow in Greenland, but the mixture of plants includes those found in much warmer habitat. See the paper for a full list.

Algae, fungi, and liverworts

Marine phytoplankton and zooplankton

A hare

A caribou-like cervid (caribou are another name for reindeer). How did they get to Greenland? Presumably it wasn’t an island then, but we don’t know for sure.

A bird related to modern geese

A rodent related to modern lemmings

Reef-building coral

An ant

A flea

A horseshoe crab (identified as Limulus polyphemus, the modern horseshoe crab, regarded as a living fossil). These days Limulus doesn’t breed north of the Bay of Fundy (about 45° N), while the location of this site was 82° N. That shows how much warmer it was in Greenland then, though of course the crabs could have evolved in the last several million years to be acclimated to warmer waters.

There were no carnivores found; all the animals were herbivores. That doesn’t mean that there weren’t carnivores there, but I doubt it.


(From paper): b, Phylogenetic placement and pathPhynder62 results of mitochondrial reads uniquely classified to Elephantidae or lower (Source Data 1). Extinct species as identified by either macrofossils or phylogenetic placements are marked with a dagger.

The upshot: Well, we know how that DNA sequences can be preserved for twice as long as we thought, though it has to be under very special circumstances. More important, if you find areas (and they’ll have to be in cold regions) where you can extract even small sequences of fossil DNA, you might be able to reconstruct whole ecosystems. What we’ve found are animals and plants that weren’t expected to be there (reindeer, horseshoe crabs, hawthorns) and so on—species adapted to warmer habitats or now found in areas not in Greenland.

There are two explanations for this: the related today have lost their adaptations to cold habitats when they were forced out of Greenland as the ice caps formed, or the climate was simply warmer. (Of course, both could apply.) But know the latter is surely a contributing factor from independent evidence about climate. Still, there could have been some evolutionary change in thermal tolerance as well, something for which we can’t really get evidence.

But these different explanations aren’t that important: what is important is that we’re able to reconstruct entire ecosystems from fossil DNA—DNA twice as old as previously known. I’ll let the authors have the last word (from the paper):

No single modern plant community or habitat includes the range of taxa represented in many of the macrofossil and DNA samples from Kap København. The community assemblage represents a mixture of modern boreal and Arctic taxa, which has no analogue in modern vegetation. To some degree, this is expected, as the ecological amplitudes of modern members of these genera have been modified by evolution. Furthermore, the combination of the High Arctic photoperiod with warmer conditions and lower atmospheric CO2 concentrations made the Early Pleistocene climate of North Greenland very different from today. The mixed character of the terrestrial assemblage is also reflected in the marine record, where Arctic and more cosmopolitan SMAGs of Opistokonta and Stramenopila are found together with horseshoe crabs, corals and green microalgae (Archaeplastida), which today inhabit warmer waters at more southern latitudes.

. . . In summary, we show the power of ancient eDNA to add substantial detail to our knowledge of this unique, ancient open boreal forest community intermixed with Arctic species, a community composition that has no modern analogues and included mastodons and reindeer, among others. Similar detailed flora and vertebrate DNA records may survive at other localities. If recovered, these would advance our understanding of the variability of climate and biotic in

Will northern Greenland be like this again should global warming continue? I doubt it, for many of the species, like caribou, can no longer get there, and some, like mastodons, are simply extinct. But it’s enough to know what was there two million years ago.

______________

Kjær, K.H., Winther Pedersen, M., De Sanctis, B. et al. A 2-million-year-old ecosystem in Greenland uncovered by environmental DNANature 612, 283–291 (2022). https://doi.org/10.1038/s41586-022-05453-y

Does anybody want to read a long paper?

August 27, 2020 • 11:00 am

I really did try to read this Science paper about urban ecology and systemic racism, first reading it quickly, as I’m wont to do, and then starting to delve in, “perusing” it in the proper sense. But I had to give up on several grounds:its  length (18 pages, one of the longest papers I’ve ever seen in Science), terrible academic writing in a postmodern style (dry as dust), an absence of original data, and, apparently, an explicitly political agenda that comes out in the end.

Given that I didn’t read the entire paper carefully, I can’t really assess its value, but I provide a link to the free paper below (pdf here, link at the bottom).  If you’d like to see it, I’ll send a pdf, but perhaps at least one reader can plow through it and put its message into plain English. To me the message seems to be: “Structural racism in America has affected minority communities in a way different from white communities with respect to their ecology (heat distribution, tree cover, etc.), and we need to take this into account this when doing urban ecology. And this also means that ecologists need to become anti-racism activists.”

Click on the screenshot to read it:

The abstract:

Here are two bits that put me off. The first is about intersectionality, which I don’t see as relevant to their question (bolding in text is mine).

Intersecting forms of inequality

Understanding the mechanisms shaping urban inequality and thus urban eco-evolutionary patterns and processes requires incorporating intersectional theories of inequality and evaluating accessibility to different spaces (34138139). The term “intersectionality” emphasizes that various marginalized identities of an individual or community more broadly intersect, compound, and interact, which ultimately impact the magnitude and severity of experienced social inequities (Fig. 1) (57). For example, discrimination for a queer Black woman in the United States may be intensified relative to individuals with similar racial, gender, and sexual orientation identities alone. Translating the concept of intersectionality onto the urban landscape can provide a more holistic understanding of the patterns and processes shaping urban ecosystems. For instance, we may hypothesize that characteristic differences between Indigenous ecological practices and forestland managers may contribute to variance in native species richness and community complexity. (140141). Similarly, we may predict that gender differences in land cultivation and homeownership shape plant species assemblages and species turnover rates. Further, vegetation removal and increased nighttime lighting to deter LGBTQIA+ communities (95) may have subsequent effects on disturbance regimes and local biodiversity that reduce habitat value for multiple species. Though such empirical links are currently speculative and not well established, integration of various inequities in cities may provide additional resolution to understanding how social drivers impact urban ecology and evolution. While our focus has been on racism and classism, we recognize the need for and encourage intersectional approaches in urban ecology.

It’s not clear to me that intersectionality as defined in the article has anything to do with the three hypothetical analyses they propose.

The bit below seems to me one of the real auns of the paper—to call for political change. That’s very different from doing the science, i.e., trying to understand how racial oppression, poverty, and class have affected patterns in urban ecology. One can say, for instance, that there are real effects, but ecologists might respond that there are other problems on their minds, like global warming and extinction of species outside of urban environment, that are also important, and reject the argument about what their activist priorities should be.

As urban ecologists and evolutionary biologists, we have a responsibility to implement anti-racist strategies that interrogate systems of oppression in how we perform our science. This necessarily means eradicating efforts that perpetuate inequities to knowledge access, neglect local community participation, or exploit community labor in the pursuit of academic knowledge (i.e., the practices of colonial and parachute science). Concurrently, increasing representation of individuals of diverse identities is inherently just and enhances our scholarship (166167). By directly including a diversity of scholars and incorporating an understanding of systemic racism and inequality, we can more holistically study urban ecosystems. We will not be able to successfully assess how racism and classism shape urban ecosystems – nor address their consequences – without a truly diverse and inclusive scientific community.

Again, I haven’t read the whole paper carefully, though I have read it quickly. I’d welcome anybody biting the bullet here.


________________

Schell, C. J., K. Dyson, T. L. Fuentes, S. Des Roches, N. C. Harris, D. S. Miller, C. A. Woelfle-Erskine, and M. R. Lambert. 2020. The ecological and evolutionary consequences of systemic racism in urban environments.  Science,Published online 13 August, 2020. DOI: 10.1126/science.aay4497

ZeFrank on snails that surf (and his Earth Day Awards)

May 3, 2020 • 12:30 pm

Is it my imagination, or is ZeFrank getting more biology into his posts than before? This is a good one, with a lot of good biology but also with the usual humor. It’s also scary!  Look at that radula!

The species at issue is the suspension-feeding and surfing sea snail Olivella semistriata and its predator Agaronia propatula.

I suppose ZeFranks gets his videos from others (there are some credits at the end), but I don’t know for sure.

And another recent ZeFrank video, this time highlighting the “Earth Day Awards” for the most “special” animals.

h/t: Rick