Hamas plays fast and loose with the casualty numbers from Gaza

March 10, 2024 • 11:35 am

This article from Tablet describes “How the Gaza Ministry of Health Fakes Casualty Numbers“, and while I have a few quibbles with it (or rather, alternative but not-so-plausible interpretations), the author’s take seems pretty much on the mark. Abraham Wyner simply gives the daily and cumulative death-toll accounts of Palestinians taken from the Hamas-run Gazan Health Ministry between October 26 and November 10 of last year, and subjects them to graphical and statistical analyses.

The conclusion is that somebody is making these figures up.  They aren’t necessarily inaccurate, but the article makes a strong case that there’s some serious fiddling going on. And the fiddling seems to be, of course, in the direction that Hamas wants.

I’ve put the figures Wyner uses below the fold of this post so you can see them (or analyze them) for yourself. As the author notes, “The data used in the article can be found here, with thanks to Salo Aizenberg who helped check and correct these numbers.”

Click on the link to read.

The data are the daily totals of “women”, “children”, and “men” (men are “implied”, which probably means that Wyner got “men” by subtracting children and women from the “daily totals”). Also given are the cumulative totals in the third column and the daily totals in the last column.

When you look at the data or the analysis, remember three things:

  1. “Children” are defined by Hamas as “people under 18 years old”, which of course could include male terrorists
  2. “Men” include terrorists as well as any civilians killed, and there is no separation, so estimates of terrorists death tolls vary between Hamas and the IDF, with the latter estimating that up to half of deaths of men could be terrorists
  3. A personal note: I find it ironic that Hamas can count the deaths to a person but also say they don’t have any idea of how many hostages they have, or how many are alive.

On to the statistics. I’ll put Wyner’s main findings in bold (my wording), and his own text is indented, while mine is flush left.

The cumulative totals are too regular. If you look at the cumulate death totals over the period, they seem to go up at a very even and smooth rate, as if the daily totals were confected to create that rate. Here’s the graph:
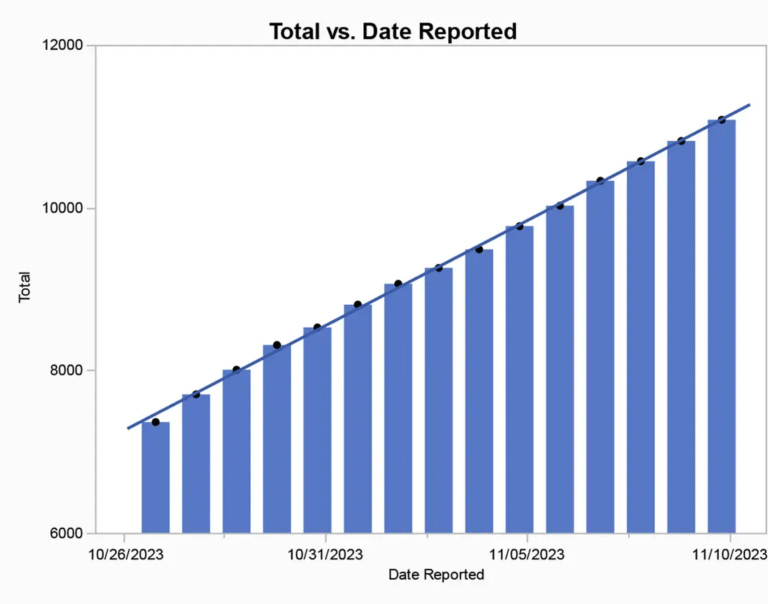
(From author): The graph reveals an extremely regular increase in casualties over the period. Data aggregated by the author and provided by the United Nations Office for the Coordination of Humanitarian Affairs (OCHA), based on Gaza MoH figures.

Cumulative totals will always look smoother than the daily totals, so this may be a bit deceptive to the eye. However, Wyner also deals with the daily totals, which are simply too similar to each other to imply any kind of irregular daily death toll, which one would expect in a war like this.  As he says of the above:

This regularity is almost surely not real. One would expect quite a bit of variation day to day. In fact, the daily reported casualty count over this period averages 270 plus or minus about 15%. This is strikingly little variation. There should be days with twice the average or more and others with half or less. Perhaps what is happening is the Gaza ministry is releasing fake daily numbers that vary too little because they do not have a clear understanding of the behavior of naturally occurring numbers. Unfortunately, verified control data is not available to formally test this conclusion, but the details of the daily counts render the numbers suspicious.

The figures for “children” and “women” should be correlated on a daily basis, but aren’t.  Here’s what Wyner says before he shows the lack of correlation:

Similarly, we should see variation in the number of child casualties that tracks the variation in the number of women. This is because the daily variation in death counts is caused by the variation in the number of strikes on residential buildings and tunnels which should result in considerable variability in the totals but less variation in the percentage of deaths across groups. This is a basic statistical fact about chance variability. Consequently, on the days with many women casualties there should be large numbers of children casualties, and on the days when just a few women are reported to have been killed, just a few children should be reported. This relationship can be measured and quantified by the R-square (R² ) statistic that measures how correlated the daily casualty count for women is with the daily casualty count for children. If the numbers were real, we would expect R² to be substantively larger than 0, tending closer to 1.0. But R² is .017 which is statistically and substantively not different from 0.

This lack of correlation is the second circumstantial piece of evidence suggesting the numbers are not real. But there is more. . .

This seems reasonable to me, although if a large number of “children” are really terrorists fighting the IDF and are not with women, this could weaken the correlation. But given Hamas’s repeated showing of small children in its propaganda, one would indeed expect a pretty strong correlation. In fact, the probability of getting this value of R² (actually, the proportion of the variation in daily women killed explained by the number of men killed) is a high 0.647, which means that if there was no association, you would get an R² this large almost 65% of the time. To be significant the probability should be less than 0.05: less than a 5% probability that the observation association would have happened by chance alone.

(From author): The daily number of children reported to have been killed is totally unrelated to the number of women reported. The R² is .017 and the relationship is statistically and substantively insignificant.

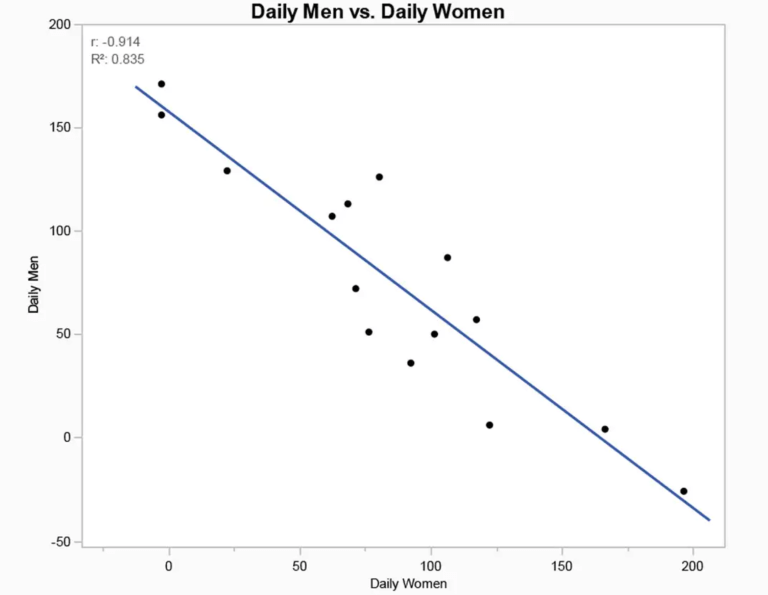
There is a strong negative correlation between the number of men killed and the number of women killed.  The daily data plotted over time shows that this is a very strong relationship: the more women killed on a given day, the fewer men killed on that day.  Below is the plot and what the author says about it.

The daily number of women casualties should be highly correlated with the number of non-women and non-children (i.e., men) reported. Again, this is expected because of the nature of battle. The ebbs and flows of the bombings and attacks by Israel should cause the daily count to move together. But that is not what the data show. Not only is there not a positive correlation, there is a strong negative correlation, which makes no sense at all and establishes the third piece of evidence that the numbers are not real.

The correlation between the daily men and daily women death count is absurdly strong and negative (p-value < .0001).

The figure is indeed strongly negative, and isn’t due to just one or two outliers. The  R value itself (the Pearson correlation coefficient) is a huge -0.914 and what we would call “highly significant”, with a probability that a correlation this large have occurred by chance being less than one in ten thousand. It’s clearly a meaningful relationship.

Is there a genuine explanation for this, one suggesting that the numbers are not made up? I could think of only one: on some days men are being targeted, as in military operations, while on other days both sexes are targeted, as if Israel is bombing both sexes willy-nilly. But that doesn’t make sense, either—not unless the men and women are in separate locations (when a lot of women are killed on a given day, almost no men are killed). Look at the data below the fold, for example: on October 30 no women were reported killed but 171 men were killed.  That could happen only if on that day Israel was targeting only men, which would mean they were going after terrorists. But that’s not Hamas’s interpretation, of course.

Conversely, on the next day 6 men were reported killed and 125 women.  Was the IDF targeting women? None of this makes sense.

There are other anomalies in the data. Here’s one:

. . . . the death count reported on Oct. 29 contradicts the numbers reported on the 28th, insofar as they imply that 26 men came back to life. This can happen because of misattribution or just reporting error.

Indeed, as on October 29 there were 2619 deaths in the cumulative total of men (implied), but on the day before, October 28, there were more: 2645! Take a look at the chart below the fold.

One more anomaly:

There are a few other days where the numbers of men are reported to be near 0. If these were just reporting errors, then on those days where the death count for men appears to be in error, the women’s count should be typical, at least on average. But it turns out that on the three days when the men’s count is near zero, suggesting an error, the women’s count is high. In fact, the three highest daily women casualty count occurs on those three days.

Here’s how the author explains the data:

Taken together, what does this all imply? While the evidence is not dispositive, it is highly suggestive that a process unconnected or loosely connected to reality was used to report the numbers. Most likely, the Hamas ministry settled on a daily total arbitrarily. We know this because the daily totals increase too consistently to be real. Then they assigned about 70% of the total to be women and children, splitting that amount randomly from day to day. Then they in-filled the number of men as set by the predetermined total. This explains all the data observed.

After deciding that we can’t get any numbers other than these, and adding that we can’t differentiate civilians from soldiers, or accidental deaths caused by misfired Gazan rockets, Wyner leave us with this conclusion:

The truth can’t yet be known and probably never will be. The total civilian casualty count is likely to be extremely overstated. Israel estimates that at least 12,000 fighters have been killed. If that number proves to be even reasonably accurate, then the ratio of noncombatant casualties to combatants is remarkably low: at most 1.4 to 1 and perhaps as low as 1 to 1. By historical standards of urban warfare, where combatants are embedded above and below into civilian population centers, this is a remarkable and successful effort to prevent unnecessary loss of life while fighting an implacable enemy that protects itself with civilians.

People tend to forget this ratio, which is stunningly low for fighting a war in close quarters against an enemy that uses human shields. (The link to “historical standards” goes to PBS and an AP report, so it isn’t exactly from Hamas).  Besides showing us that we can’t trust Hamas’s figures, which nevertheless are touted in all the media, it also shows that there is no indication that the Israelis are trying to wipe out the Palestinian people; that is, there is no genocide going on.

But it would be nice, if newer figures were available, to see if these anomalies are still there. This article is from March 6, so it’s pretty new.

Click “continue reading” to see the data

Continue reading “Hamas plays fast and loose with the casualty numbers from Gaza”

The ideologues: why we can’t use statistics any more

November 27, 2022 • 10:00 am

I could go on and on about the errors and misconceptions of the paper from Nautilus below, whose aims are threefold. First, to convince us that several of the founders of modern statistics, including Francis Galton, Karl Pearson, and Ronald Fisher, were racists. Second, to argue that the statistical tests they made famous, and are used widely in research (including biomedical research), were developed as tools to promote racism and eugenics. Third, that we should stop using statistical analyses like chi-squared tests, Fisher exact tests, analyses of variance, t-tests, or even fitting data to normal distributions, because these exercises are tainted by racism.  I and others have argued that the first claim is overblown, and I’ll argue here that the second is wrong and the third is insane, not even following from the first two claims if they were true.

Click on the screenshot to read the Nautilus paper. The author, Aubrey Clayton, is identified in the piece as “a mathematician living in Boston and the author of the forthcoming book Bernoulli’s Fallacy.”

The first thing to realize is that yes, people like Pearson, Fisher, and Galton made racist and classist statements that would be deemed unacceptable today. The second is that they conceived of “eugenics” as not a form of racial slaughter, like Hitler, but by encouraging the white “upper classes” (whom they assumed had “better genes”) to have more kids and discourage the breeding of the white “lower classes.” But none of their writing on eugenics (which was not the dominant interest of any of the three named) had any influence on eugenic practice, since Britain never practiced eugenics. Clayton desperately tries to forge a connection between the Brits and Hitler via an American (the racist Madison Grant) who, he says, was influenced by the Brits and who himself influenced Hitler, but the connection is tenuous. Nevertheless, this photo appears in the article. (Isn’t there some law about dragging Hitler into every discussion as a way to make your strongest point?)

My friend Luana suggested that I use this children’s book to illustrate Clayton’s  point:

As the email and paper I cite below show, Clayton is also wrong in arguing that the statical methods devised by Pearson, Galton, and especially Fisher, were created to further their eugenic aspirations. In fact, Clayton admits this for several tests (bolding is mine).

One of the first theoretical problems Pearson attempted to solve concerned the bimodal distributions that Quetelet and Galton had worried about, leading to the original examples of significance testing. Toward the end of the 19th century, as scientists began collecting more data to better understand the process of evolution, such distributions began to crop up more often. Some particularly unusual measurements of crab shells collected by Weldon inspired Pearson to wonder, exactly how could one decide whether observations were normally distributed?

Before Pearson, the best anyone could do was to assemble the results in a histogram and see whether it looked approximately like a bell curve. Pearson’s analysis led him to his now-famous chi-squared test, using a measure called Χ2 to represent a “distance” between the empirical results and the theoretical distribution. High values, meaning a lot of deviation, were unlikely to occur by chance if the theory were correct, with probabilities Pearson computed. This formed the basic three-part template of a significance test as we now understand it. . .

If the chi-squared test was developed to foster eugenics, it was the eugenics of crabs! But Clayton manages to connect the crab study to eugenics:

Applying his tests led Pearson to conclude that several datasets like Weldon’s crab measurements were not truly normal. Racial differences, however, were his main interest from the beginning. Pearson’s statistical work was inseparable from his advocacy for eugenics. One of his first example calculations concerned a set of skull measurements taken from graves of the Reihengräber culture of Southern Germany in the fifth to seventh centuries. Pearson argued that an asymmetry in the distribution of the skulls signified the presence of two races of people. That skull measurements could indicate differences between races, and by extension differences in intelligence or character, was axiomatic to eugenicist thinking. Establishing the differences in a way that appeared scientific was a powerful step toward arguing for racial superiority.

How many dubious inferential leaps does that paragraph make? I count at least four. But I must pass on to other assertions.

Ronald Fisher gets the brunt of Clayton’s ire because, says Clayton, Fisher developed his many famous statistical tests (including analysis of variance, the Fisher exact test, and so on) to answer eugenic questions. This is not true. Fisher espoused the British classist view of eugenics, but he also developed his statistical tests for other reasons, even if he ever applied them to eugenic questions. In fact, the Society of the Study of Evolution (SSE), when deciding to rename its Fisher Prize for graduate-student accomplishment, says that the order of eugenics —> statistical tests is reversed:

Alongside his work integrating principles of Mendelian inheritance with processes of evolutionary change in populations and applying these advances in agriculture, Fisher established key aspects of theory and practice of statistics.

Fisher, along with other geneticists of the time, extended these ideas to human populations and strongly promoted eugenic policies—selectively favoring reproduction of people of accomplishment and societal stature, with the objective of genetically “improving” human societies.

In this temporal ordering, which happens to be correct (see below), the statistics are not tainted by eugenics and thus don’t have to be thrown overboard. As I reported in a post last year, several of us wrote a letter to the SSE trying to correct its misconceptions (see here for the letter, which also corrects misconceptions about Fisher’s racism), but the SSE politely rejected it.

Towards the end of his article, Clayton calls for eliminating the use of these “racist” statistics, though they’ve saved many lives since they’re used in medical trials, and have also been instrumental in helping scientists in many other areas understand the universe. Clayton manages to dig up a few extremists who also call for eliminating the use of statistics and “significance levels” (the latter issue could, in truth, be debated), but there is nothing that can replace the statistics developed by Galton, Pearson, and Fisher. I’ll give two quotes showing that, in the end, Clayton is a social-justice crank who thinks that objectivity is overrated. Bolding is mine:

Nathaniel Joselson is a data scientist in healthcare technology, whose experiences studying statistics in Cape Town, South Africa, during protests over a statue of colonial figure Cecil John Rhodes led him to build the website “Meditations on Inclusive Statistics.” He argues that statistics is overdue for a “decolonization,” to address the eugenicist legacy of Galton, Pearson, and Fisher that he says is still causing damage, most conspicuously in criminal justice and education. “Objectivity is extremely overrated,” he told me. “What the future of science needs is a democratization of the analysis process and generation of analysis,” and that what scientists need to do most is “hear what people that know about this stuff have been saying for a long time. Just because you haven’t measured something doesn’t mean that it’s not there. Often, you can see it with your eyes, and that’s good enough.”

Statistics, my dear Joselson, was developed precisely because what “we see with our eyes” may be deceptive, for what we often see with our eyes is what we want to see with our eyes. It’s called “ascertainment bias.”  How do Joselson and Clayton propose to judge the likelihood that a drug really does cure a disease? Through “lived experience”?

It goes on. Read and weep (or laugh):

To get rid of the stain of eugenics, in addition to repairing the logic of its methods, statistics needs to free itself from the ideal of being perfectly objective. It can start with issues like dismantling its eugenicist monuments and addressing its own diversity problems. Surveys have consistently shown that among U.S. resident students at every level, Black/African-American and Hispanic/Latinx people are severely underrepresented in statistics.

. . . Addressing the legacy of eugenics in statistics will require asking many such difficult questions. Pretending to answer them under a veil of objectivity serves to dehumanize our colleagues, in the same way the dehumanizing rhetoric of eugenics facilitated discriminatory practices like forced sterilization and marriage prohibitions. Both rely on distancing oneself from the people affected and thinking of them as “other,” to rob them of agency and silence their protests.

How an academic community views itself is a useful test case for how it will view the world. Statistics, steeped as it is in esoteric mathematical terminology, may sometimes appear purely theoretical. But the truth is that statistics is closer to the humanities than it would like to admit. The struggles in the humanities over whose voices are heard and the power dynamics inherent in academic discourse have often been destructive, and progress hard-won. Now that fight may have been brought to the doorstep of statistics.

In the 1972 book Social Sciences as Sorcery, Stanislav Andreski argued that, in their search for objectivity, researchers had settled for a cheap version of it, hiding behind statistical methods as “quantitative camouflage.” Instead, we should strive for the moral objectivity we need to simultaneously live in the world and study it. “The ideal of objectivity,” Andreski wrote, “requires much more than an adherence to the technical rules of verification, or recourse to recondite unemotive terminology: namely, a moral commitment to justice—the will to be fair to people and institutions, to avoid the temptations of wishful and venomous thinking, and the courage to resist threats and enticements.”

The last paragraph is really telling, for it says one cannot be “objective” without adhering to the same “moral commitment to justice” as does the author. That is nonsense. Objectivity is the refusal to take an a priori viewpoint based on your political, moral, or ideological commitments, not an explicit adherence to those commitments.

But enough; I could go on forever, and my patience, and yours, is limited. I will quote two other scientists.

The first is A. W. F. Edwards, a well known British geneticist, statistician, and evolutionary biologist. He was also a student of Fisher’s, and has defended him against calumny like Clayton’s. But read the following article for yourself (it isn’t published, for it was written for his College at Cambrige, which was itself contemplating removing memorials to Fisher). I’ll be glad to send the pdf to any reader who wants it:

Here’s the abstract, but do read the paper, available on request:

In June 2020 Gonville and Caius College in Cambridge issued a press announcement that its College Council had decided to ‘take down’ the stained-glass window which had been placed in its Hall in 1989 ready for the centenary of Sir Ronald Fisher the following year. The window depicted the colourful Latin-Square pattern from the jacket of Fisher’s 1935 book The Design of Experiments. The window was one of a matching pair, the other commemorating John Venn with the famous three-set ‘Venn diagram’, each window requiring seven colours which were the same in both (Edwards, 2002; 2014a). One of the arguments advanced for this action was Fisher’s interest in eugenics which ‘stimulated his interest in both statistics and genetics’*.

In this paper I challenge the claim by examining the actual sequence of events beginning with 1909, the year in which Fisher entered Gonville and Caius College. I show that the historians of science who promoted the claim paid inadequate attention to Fisher’s actual studies in statistics as part of his mathematical education which were quite sufficient to launch him on his path-breaking statistical career; they showed a limited understanding of the magnitude of Fisher’s early achievements in theoretical statistics and experimental design, which themselves had no connection with eugenics. Secondly, I show that Fisher’s knowledge of natural selection and Mendelism antedated his involvement in eugenics; and finally I stress that the portmanteau word ‘eugenics’ originally included early human genetics and was the subject from which modern human and medical genetics grew.

Finally, I sent the article to another colleague with statistical and historical expertise, and he/she wrote the following, quoted with permission:

There is an authoritative history of statistics by Stephen Stigler of the UoC. There’s also an excellent biography of Galton by Michael Bulmer. Daniel Kevles’s book is still the best account of the history of eugenics, and he gives a very good account of how it developed into human genetics, largely due to Weinberg, Fisher and Haldane. Genetic counselling is in fact a form of eugenics, and only religious bigots are against it. Eugenics has become a dirty word, associated with Nazism and other forms of racism.

According to Stigler, many early developments, like the normal distribution and least squares estimation, were developed by astronomers and physicists such as Gauss and Laplace in order to deal with measurement error. Galton invented the term ‘regression’ when investigating the relations between parent and offspring, but did not use the commonly used least squares method of estimation, although this had been introduced much earlier by Legendre. Galton consistently advocated research into heredity rather than applied eugenics, undoubtedly because he felt a firm scientific base was needed as a foundation for eugenics.

Like Fisher, Galton and Pearson were interested in ‘improving the stock’, which had nothing to do with racial differences;  even Marxists like Muller and Haldane were advocates of positive eugenics of this kind. I think there are many arguments against positive eugenics, but it is misguided to make out that it is inherently evil in the same way as Nazism and white supremacism.

No doubt Galton and Pearson held racist views, but these were widespread at the time, and had nothing to do with the eugenics movement in the UK; in fact, the Eugenics Society published a denunciation of Nazi eugenics laws in 1933  and explicitly dissociated eugenics from racism (see http://www.senns.uk/The_Eug_Soc_and_the_Nazis.pdf). People are confused about this, because the word ‘race’ was then widely used in a very loose sense to refer to what we would now refer to as a population (Churchill used to refer to the ‘English race’: he was himself half American).

Fisher’s work in statistics was very broadly based and not primarily motivated by genetics; he discovered the distribution of t as a result of correspondence with the statistician W.S. Gossett at Guinness’s brewery in Dublin, and his major contributions to experimental design and ANOVA were made in connection with agricultural research at the Rothamstead experimental station (who have renamed their ‘Fisher Court’ as ‘ANOVA Court’). Maybe everyone should give up drinking Guinness and eating cereal products, since they are allegedly contaminated in this way.

QED

Americans’ abysmal ability to estimate group sizes

November 8, 2022 • 10:30 am

I found this article fascinating, and the explanations intriguing.  Two YouGov polls surveyed 1,000 Americans (2,000 total) in January of each year, asking people to estimate the proportions of Americans in 43 different groups.  A large number of these estimates were wildly inaccurate, particularly when minority groups were surveyed (estimates were way too high) as well as “majority” groups (e.g., “Christians”), where estimates were too low. Read on; there’s a sociological explanation for such mis-estimation, though I don’t know how well supported it is.

Click to read (it’s free):

First the data, with calculations explained in the figure:

The pattern is one of overestimating the sizes of minority groups and underestimating sizes of majority groups. Groups hovering around the middle tend to be estimated more accurately:

When people’s average perceptions of group sizes are compared to actual population estimates, an intriguing pattern emerges: Americans tend to vastly overestimate the size of minority groups. This holds for sexual minorities, including the proportion of gays and lesbians (estimate: 30%, true: 3%), bisexuals (estimate: 29%, true: 4%), and people who are transgender (estimate: 21%, true: 0.6%).

It also applies to religious minorities, such as Muslim Americans (estimate: 27%, true: 1%) and Jewish Americans (estimate: 30%, true: 2%). And we find the same sorts of overestimates for racial and ethnic minorities, such as Native Americans (estimate: 27%, true: 1%), Asian Americans (estimate: 29%, true: 6%), and Black Americans (estimate: 41%, true: 12%).

A parallel pattern emerges when we look at estimates of majority groups: People tend to underestimate rather than overestimate their size relative to their actual share of the adult population. For instance, we find that people underestimate the proportion of American adults who are Christian (estimate: 58%, true: 70%) and the proportion who have at least a high school degree (estimate: 65%, true: 89%).

The most accurate estimates involved groups whose real proportion fell right around 50%, including the percentage of American adults who are married (estimate: 55%, true: 51%) and have at least one child (estimate: 58%, true: 57%).

This tendency to overestimate small groups and underestimate large ones has been seen in other studies.  The data that fascinate me are of course the wild overestimate of the population of Jews and Muslims (often cited as trying to “take over the country”, as well as of atheists and gays.  I thought everybody had a rough idea of the proportion of blacks in the U.S., but this, too is grossly overestimated. And how people can think that 30% of Americans can live in New York City eludes me (30%, like all the figures, are medians among guesses). If that were true, the city would have a population of 100 million!

On the underestimage size, disparities are smaller, but one of them surprises me: the median estimate of proportion of people who have read a book in the last year is just 50%, while the actual figure is 77%. I’m not sure abut the reason for this disparity, but I’m still horrified that only about 3/4 of Americans have read a book in a whole year (frankly, I would have guessed that it would be less).

The authors note that the overestimates of minority groups aren’t likely to be due to fear of such groups, since actual members of those groups tend to show the same degree of overestimation as do non-members. That, too, baffles me. How could a Jew think that 30% of Americans are Jewish? I always knew it was about 2%, and that’s the correct proportion.

Now, what’s the explanation? Here’s what YouGov says:

Why is demographic math so difficult? One recent meta-study suggests that when people are asked to make an estimation they are uncertain about, such as the size of a population, they tend to rescale their perceptions in a rational manner. When a person’s lived experience suggests an extreme value — such as a small proportion of people who are Jewish or a large proportion of people who are Christian — they often assume, reasonably, that their experiences are biased. In response, they adjust their prior estimate of a group’s size accordingly by shifting it closer to what they perceive to be the mean group size (that is, 50%). This can facilitate misestimation in surveys, such as ours, which don’t require people to make tradeoffs by constraining the sum of group proportions within a certain category to 100%.

This reasoning process — referred to as uncertainty-based rescaling — leads people to systematically overestimate the size of small values and underestimate the size of large values. It also explains why estimates of populations closer to 0% (e.g., LGBT people, Muslims, and Native Americans) and populations closer to 100% (e.g., adults with a high school degree or who own a car) are less accurate than estimates of populations that are closer to 50%, such as the percentage of American adults who are married or have a child.

I suppose this could be called “psychological regression to the mean.” It doesn’t fully convince me, though, because I’d think people would go on their “lived experience” rather than assume their experience has given them a biased sample of the size of a group. But I haven’t read the meta-study in the link.


h/t: Winnie

The New York Times might have used Bayes’ Theorem

January 4, 2022 • 10:00 am

by Greg Mayer

The New York Times has a data analysis division which they call The Upshot; I think they created it to compensate for the loss of Nate Silver’s 538, which was once hosted by the Times. The Upshot reporters and analysts tend to be policy wonks with some statistical savvy, so I took note of a big story they had on page 1 of Sunday’s (2 January) paper on why many prenatal tests “are usually wrong.

The upshot, if you will, of the story is that many prenatal tests for rare chromosomal disorders unnecessarily alarm prospective parents because, even if the test result is positive, it is unlikely that the fetus actually has the disease. This is because when a disease is rare most positives are false positives, even when the test is quite accurate. For the five syndromes analyzed by the Times, the proportion of false positives (i.e. “wrong” results) ranged from 80% to 93%!

The Times does not go into detail of how they got those figures, but from links in their footnotes, I think they are empirical estimates, based on studies which did more conclusive followup testing of individuals who tested positive. My first thought, when looking at Sunday’s paper itself (which of course doesn’t have links!), was that they had used Bayes’ Theorem, the manufacturers’ stated sensitivity and specificity for their tests (the two components of a test’s accuracy), and the known prevalence of the condition to calculate the false positive rate.

Bayes’ Theorem is an important result in probability theory, first derived by the Rev. Thomas Bayes, and published posthumously in 1763. There is controversy over the school of statistical inference known as Bayesian statistics; the controversy concerns how one can form a “prior probability distribution”, but in this case we have an empirically derived prior probability distribution, the prevalence, which can be thought of as the probability of an individual drawn at random from the population in which the prevalence is known (or well-estimated) having the condition. There is thus no controversy over the application of Bayes’ Theorem to cases of disease diagnosis when there is a known prevalence of the condition, such as in the cases at hand.

Here’s how it works. (Remember, though, that I think the Times used empirical estimates of the rate, not this type of calculation.)

Using Bayes’ Theorem, we can say that the probability of having a disease (D) given a positive test result (+) depends on the sensitivity of the test (= the probability of a positive result given an individual has the disease, P(+∣D)), the specificity of the test (= the probability of a negative result given an individual does not have the disease, P(-∣ not D)), and the prevalence of the disease (= the probability that a random individual has the disease, P(D)). Formally,

P(D∣+) = P(+∣D)⋅P(D)/P(+)

where the terms are as defined above, and P(+) is the probability of a random individual testing positive. This is given by the sensitivity times the prevalence plus the specificity times (1- the prevalence), or

P(+) = P(+∣D)⋅P(D) + P(+∣ not D)⋅(1-P(D))

The whole thing in words can be put as

probability you are ill given a positive test =

sensitivity⋅prevalence/[sensitivity⋅prevalence + (1-specificity)⋅(1-prevalence)]

Let’s suppose we have a sensitive test, say P(+∣D)=.95, which is also quite specific, say P(-∣ not D)=.95 (sensitivity and specificity need not be equal; this is only a hypothetical), and a low prevalence, say P(D)=.01. Then

probability you are ill given a positive test =

= (.95)(.01)/[(.95)(.01)+(.05)(.99)]

= .16.

Thus, if you had a positive test, 84% of the time it would be “wrong”! This is right in the neighborhood of the rates found by the Times for the five conditions they examined. Notice that in this example, both sensitivity and specificity are high (which is good– you want both of these to be near the maximum of 1.0 if possible), but because prevalence is low (.01), the test is still usually “wrong”.

In an earlier discussion of Bayes’ Theorem, Jerry noted:

This [tests for rare conditions being usually wrong] is a common and counterintuitive result that could be of practical use to those of you who get a positive test. Such tests almost always mandate re-testing!

He’s absolutely right. A test with these properties is useful for screening, but not for diagnosis– you’d usually want to get a more definitive test before making any irreversible medical decisions. (For COVID 19, for example, PCR tests are more definitive than the quicker antigen tests.) The Times also discusses some of the unsavory aspects of the marketing of these tests, and the tragedy of the truly life and death decisions that can ensue, all of which flow from the results of the tests being misunderstood.

(Note: an alert reader spotted a mistake in the verbal equation, and in checking on it I spotted another in one of the symbolic equations. Both corrections have now been made, which are in bold above. The numerical result was not affected, as I’d used the correct numbers for the calculation, even though my verbal expression of them was wrong!)


For a nice but brief discussion, with some mathematical details, of the application of Bayes’ theorem to diagnosis, see sections 1.1-1.3 of Richard M. Royall’s Statistical Evidence: A Likelihood Paradigm (Chapman &Hall, London, 1996). Royall is not a Bayesian, which demonstrates the uncontroversial nature of the application of Bayes’ Theorem to diagnosis.

Assessing Ronald Fisher: should we take his name off everything because he espoused eugenics?

January 18, 2021 • 11:00 am

Many consider Ronald Fisher (1890-1962) one of the greatest biologists—and probably the greatest geneticist—of the 20th century, for he was a polymath who made hugely important contributions in many areas. He’s considered the father of modern statistics, developing methods like analysis of variance and chi-square tests still used widely in science and social science. His pathbreaking work on theoretical population genetics, embodied in the influential book The Genetical Theory of Natural Selection, included establishing that Mendelian genetics could explain the patterns of correlation among relatives for various traits, and helped bring about the reconciliation of genetics and natural history that constituted the “modern synthesis” of evolution. His theoretical work presaged the famous “neutral theory” of molecular evolution and established the efficacy of natural selection—the one part of Darwin’s theory that wasn’t widely accepted in the early 20th century.

Fisher also made advances important to medicine, like working out the genetics of Rh incompatibility, once an important cause of infant death. His statistical analyses are regularly used in modern medical studies, especially partitioning out the contributors to maladies and in analyzing control versus experimental groups (they were surely used in testing the efficacy of Covid vaccines).  As the authors of a new paper on Fisher say, “The widespread applications of Fisher’s statistical developments have undoubtedly contributed to the saving of many millions of lives and to improvements in the quality of life. Anyone who has done even a most elementary course in statistics will have come across many of the concepts and tests that Fisher pioneered.”

That is indeed the case, for statistical methods don’t go out of fashion very easily, especially when they’re correct!

Unfortunately, Fisher was also an exponent of eugenics, and for this he’s recently starting to get canceled. Various organizations, like the Society for the Study of Evolution and the American Statistical Association, have taken his name off awards, and Fisher’s old University of Cambridge college, Gonville and  Caius, removed their “Fisher window” (a stained glass window honoring Fisher’s statistical achievements) from their Hall last year.  Further disapprobation is in store as well.

This article in Heredity by a panoply of accomplished British statisticians and geneticists (Bodmer was one of Fisher’s last Ph.D. students) attempts an overall evaluation of Fisher’s work, balancing the positive benefits against his work and views on eugenics. If you are a biologist, or know something about Fisher, you’ll want to read it (click on the screenshot below, get the pdf here, and see the reference at the bottom.)

The authors make no attempt to gloss over Fisher’s distasteful and odious eugenics views, but do clarify what he favored. These included a form of positive eugenics, promoting the intermarriage of accomplished (high IQ) people, as well as negative eugenics: sterilization of the “feeble minded.” The latter was, however, always seen by Fisher as a voluntary measure, never forced. While one may ask how someone who is mentally deficient can give informed consent, Fisher favored “consent” of a parent or guardian (and concurrence of two physicians) before sterilization—if the patients themselves weren’t competent. But is that really “consent”? Negative eugenics on the population kind (not the selective abortion of fetuses carrying fatal disease, which people do every day) is something that’s seen today as immoral.

Further, Fisher’s views were based on his calculations that the lower classes outbred the higher ones, which, he thought, would lead to an inevitable evolutionary degeneration of society. But he was wrong: oddly, he didn’t do his sums right, as was pointed out much later by Carl Bajema. When you do them right, there’s no difference between the reproductive output of “higher” and “lower” classes.

Contrary to the statements of those who have canceled Fisher, though, he wasn’t a racist eugenist, although he did think that there were behavioral and intelligence differences between human groups, which is likely to be true on average but is a taboo topic—and irrelevant for reforming society. Fisher’s eugenics was largely based on intelligence and class, not race. Fisher was also clueless about the Nazis, though there is no evidence that he or his work contributed to the Nazi eugenics program.

In fact, none of Fisher’s recommendations or views were ever adopted by his own government, which repeatedly rejected his recommendations for positive and negative eugenics. Nor were they taken up in America, where they did practice negative eugenics, sterilizing people without their consent. But American eugenics was largely promoted by American scientists.

My go-to procedure for assessing whether someone should be “canceled”—having their statues removed or buildings renamed and so on—involves two criteria. First, was the honorific meant to honor admirable aspects of the person—the good he or she did? Statues of Confederate soldiers don’t pass even this first test. Second, did the good that a person accomplish outweigh the bad? If the answer to both questions is “yes”, then I don’t see the usefulness of trying to erase someone’s contributions.

On both counts, then, I don’t think it’s fair for scientific societies or Cambridge University to demote Fisher, cancel prizes named after him, and so on. He held views that were common in his time (and were adhered to by liberal geneticists like A. H. Sturtevant and H. J. Muller), and his views, now seen properly as bigoted and odious, were never translated into action.

Of course the spread of wokeness means that balanced assessments like this one are rare; usually just the idea that someone espoused eugenics is enough to get them canceled and their honors removed.  It saddens me, having already known about Fisher and his views, that what I considered my “own” professional society—the Society for the Study of Evolution—and a society of which I was President, is now marinated in wokeness, cancelling Fisher, hiring “diversity” experts to police the annual meeting at great cost, and making the ludicrous assertion—especially ludicrous for an evolution society—that sex in humans is not binary (read my post on this at the link). The SSE’s motivations are good; their execution is embarrassing. I am ashamed of my own intellectual home, and of the imminent name change for the Fisher Prize, for which the Society even apologized. Much of the following “explanation” is cant, especially the part about students being put off applying for the prize:

This award was originally named to highlight Fisher’s foundational contributions to evolutionary biology. However, we realize that we cannot, in recognizing and honoring these contributions, isolate them from his racist views and promotion of eugenics–which were relentless, harmful, and unsupported by scientific evidence. We further recognize and deeply regret that graduate students, who could have been recipients of this award, may have hesitated to apply given the connotations. For this, we are truly sorry.

His promotion of genetics was not relentless, wasn’t harmful (at least in being translated into eugenics, as opposed to being simply “offensive”), and of course scientific evidence shows that you could change almost every characteristic of humans by selective breeding (eugenics). But we don’t think that’s a moral thing to do. And yes, you can separate the good someone does from their reprehensible ideas. Martin Luther King was a serial adulterer and philanderer. Yet today we are celebrating his good legacy, which far outweighs his missteps.

But I digress. I’ll leave you with the assessment of a bunch of liberals who nevertheless use Fisher’s work every day: the authors of the new paper.

The Fisher Memorial Trust, of which the authors are trustees, exists because of Fisher’s foundational contributions to genetical and statistical research. It honours these and the man who made them. Recent criticism of R. A. Fisher concentrates, as we have extensively discussed, on very limited aspects of his work and focusses attention on some of his views, both in terms of science and advocacy. This is entirely appropriate, but in re-assessing his many contributions to society, it is important to consider all aspects, and to respond in a responsible way—we should not forget any negative aspects, but equally not allow the negatives to completely overshadow the substantial benefits to modern scientific research. To deny honour to an individual because they were not perfect, and more importantly were not perfect as assessed from the perspective of hindsight, must be problematic. As Bryan Stevenson (Stevenson 2014) said “Each of us is more than the worst thing we’ve ever done.”

In one of Fisher’s last papers celebrating the centenary of Darwin’s “The Origin of Species” and commenting on the early Mendelian geneticists’ refusal to accept the evidence for evolution by natural selection he said, “More attention to the History of Science is needed, as much by scientists as by historians, and especially by biologists, and this should mean a deliberate attempt to understand the thoughts of the great masters of the past, to see in what circumstances or intellectual milieu their ideas were formed, where they took the wrong turning track or stopped short of the right” (Fisher 1959). Here, then, there is a lesson for us. Rather than dishonouring Fisher for his eugenic ideas, which we believe do not outweigh his enormous contributions to science and through that to humanity, however much we might not now agree with them, it is surely more important to learn from the history of the development of ideas on race and eugenics, including Fisher’s own scientific work in this area, how we might be more effective in attacking the still widely prevalent racial biases in our society.

***************

Below: Ronald Alymer Fisher, in India in 1937 (as the authors note, Fisher was feted by a colleague for his “incalculable contribution to the research of literally hundreds of individuals, in the ideas, guidance, ans assistance he so generously gave, irrespective of nationality, colour, class, or creed.” Unless that’s an arrant lie, that should also go toward assessing what the man actually did rather than what he thought.

Fisher in the company of Professor Prasanta Chandra Mahalanobis and Mrs. Nirmalkumari Mahalanobis in India in 1940. Courtesy of the P.C. Mahalanobis Memorial Museum and Archives, Indian Statistical Institute, Kolkata, and Rare Books and Manuscripts, University of Adelaide Library.

h/t: Matthew Cobb for making me aware of the paper.

________________

Bodmer, W., R. A. Bailey, B. Charlesworth, A. Eyre-Walker, V. Farewell, A. Mead, and S. Senn. 2021. The outstanding scientist, R.A. Fisher: his views on eugenics and race. Heredity. https://doi.org/10.1038/s41437-020-00394-6


Further thoughts on the Rev. Bayes

April 19, 2015 • 11:37 am

by Greg Mayer

I (and Jerry) have been quite pleased by the reaction to my post on “Why I am not a Bayesian“. Despite being “wonkish“, it has generated quite a bit of interesting, high level, and, I hope, productive, discussion. It’s been, as Diane G. put it, “like a graduate seminar.” I’ve made a few forays into the comments myself, but have not responded to all, or even the most interesting, comments– I had a student’s doctoral dissertation defense to attend to the day the post went up, plus I’m not sure that having the writer weigh in on every point is the best way to advance the discussion. But I do have a few general observations to make, and do so here.

Apparently not the Rev. Bayes.

First, I did not lay out in my post what the likelihood approach was, only giving references to key literature. No approach is without difficulties and conundrums, and I’m looking forward to finding the reader-recommended paper “Why I am not a likelihoodist.”  Among the most significant problems facing a likelihood approach are those of ‘nuisance’ parameters (probability models often include quantities that must be estimated in order to use the model, but in which you’re not really interested; there are Bayesian ways of dealing with these that are quite attractive), and of how to incorporate model simplicity into inference. My own view of statistical inference is that we are torn between two desiderata: to find a model that fits the data, yet retains sufficient generality to be applicable to a wider range of phenomena than just the data observed. It is always possible to have a model of perfect fit by simply having the model restate the data. In the limit, you could have the hypothesis that an omnipotent power has arranged all phenomena always and everywhere to be exactly as it wants, which hypothesis would have a likelihood of one (the highest it can be). But such an hypothesis contains within it an exact description of all phenomena always and everywhere, and thus has minimal generality or simplicity. There are various suggestions on how to make the tradeoff between fit (maximizing the likelihood of the model) and simplicity (minimizing the number of parameters in the model),  and I don’t have the solution as to how to do it (the Akaike Information Criterion is an increasingly popular approach to doing so).

Second, there are several approaches to statistical inference (not just two, or even just one, as some have said), and they differ in their logical basis and what inferences they think possible or desirable. (I mentioned likelihood, Fisherian, Neyman-Pearson, Bayesian, and textbook hodge-podge approaches in my post, and that’s not exhaustive.) But it is nonetheless the case that the various approaches often arrive at the same general (and sometimes specific) conclusion in any particular inferential analysis. Discussion often centers on cases where they differ, but this shouldn’t obscure the at times broad agreement among them. As Tony Edwards, one of the chief promoters of likelihood, has noted, the usual procedures usually lead to reasonable results, otherwise we would have been forced to give up on them and reform statistical inference long ago. One of the remarks I did make in the comments is that most scientists are pragmatists, and they use the inferential methods that are available to them, address the questions they are interested in, and give reasonable results, without too much concern for what’s going on “under the hood” of the method. So, few scientists are strict Bayesians, Fisherians, or whatever– they are opportunistic Bayesians, Fisherians, or whatever.

Third, one of the differences between Bayesian and likelihood approaches that I would reiterate is that Bayesianism is more ambitious– it wants to supply a quantitative answer (a probability) to the question “What should I believe?” (or accept). Likelihoodism is concerned with “What do the data say?”, which is a less complete question, which leads to less complete answers. It’s not that likelihoodists (or Fisherians) don’t think the further questions are interesting, but just that they don’t think they can be answered in an algorithmic fashion leading to a numerical result (unless, of course, there is a valid objective prior). Once you have a likelihood result, further considerations enter into our inferential reasoning, such as

There is good reason to doubt a proposition if it conflicts with other propositions we have good reason to believe; and

The more background information a proposition conflicts with, the more reason there is to doubt it.

(from a list I posted of principles of scientific reasoning taken from How to Think about Weird Things). Bayesians turn these considerations into a prior probability; non-Bayesians don’t.

Fourth, a number of Bayesian readers have brought attention to the development of prior probability distributions that do properly represent ignorance– uninformative priors. This is the first of the ways forward for Bayesianism that I mentioned in my original post (“First, try really hard to find an objective way of portraying ignorance.”). I should mention in this regard that someone who did a lot of good work in this area was Sir Harold Jeffreys, whose Theory of Probability is essential, and which I probably should have included in my “Further Reading” list (I was trying not to make the list too long). His book is not, as the title would suggest, an exposition of the mathematical theory of probability, but an attempt to build a complete account of scientific inference from philosophical and statistical fundamentals. Jeffreys (a Bayesian) was well-regarded by all, including Fisher (a Fisherian, who despite, or perhaps because of, his brilliance got along with scarcely anyone). These priors have left some unconvinced, but it’s certainly a worthy avenue of pursuit.

Finally, a number of readers have raised a more philosophical objection to Bayesianism, one which I had included a brief mention of in a draft of my OP, but deleted in the interest of brevity and simplicity. The objection is that scientific hypotheses are not, in general, the sorts of things that have probabilities attached to them. Along with the above-mentioned readers, we may question whether scientific hypotheses may usefully be regarded as drawn from an urn full of hypotheses, some proportion of which are true. As Edwards (1992) put it, “I believe that the axioms of probability are not relevant to the measurement of the truth of propositions unless the propositions may be regarded as having been generated by a chance set-up.” Reader Keith Douglas put it, ” “no randomness, no probability”. Even in the cases where we do have a valid objective prior probability, as in the medical diagnosis case, it’s not so much that I’m saying the patient has a 16% chance of having the disease (he either does or doesn’t have it), but rather that individuals drawn at random from the same statistical population in which the patient is situated (i.e. from the same general population and showing positive on this test) would have the disease 16% of the time.

If we can array our commitments to schools of inference along an axis from strict to opportunistic, I am nearer the opportunistic pole, but do find the likelihood approach the most promising, and most worth developing further towards resolving its anomalies and problems (which all approaches, to greater or lesser degrees, suffer from).


Edwards, A.W.F. 1992. Likelihood. Expanded edition. Johns Hopkins University Press, Baltimore.

Jeffreys, H. 1961. The Theory of Probability. 3rd edition. Oxford University Press, Oxford.

Schick, T. and L. Vaughn. 2014. How to Think About Weird Things: Critical Thinking for a New Age. 7th ed. McGraw-Hill, New York.

Why I am not a Bayesian*

April 16, 2015 • 8:45 am

JAC: Today Greg contributes his opinion on the use of Bayesian inference in statistics. I know that many—perhaps most—readers aren’t familiar with this, but it’s of interest to those who are. Further, lots of secular bloggers either write about or use Bayesian inference, as when inferring the probability that Jesus existed given the scanty data. (Theists use it too, sometimes to calculate the probability that God exists given some observations, like the supposed fine-tuning of the Universe’s physical constants.)

When I warned Greg about the difficulty some readers might have, he replied that, “I tried to keep it simple, but it is, as Paul Krugman says about some of his posts, ‘wonkish’.” So wonkish we shall have!

___________

by Greg Mayer

Last month, in a post by Jerry about Tanya Luhrmann’s alleged supernatural experiences, I used a Bayesian argument to critique her claims, remarking parenthetically that I am not a Bayesian. A couple of readers asked me why I wasn’t a Bayesian, and I promised to reply more fully later. So, here goes; it is, as Paul Krugman says, “wonkish“.

Approaches to inference

I studied statistics as an undergraduate and graduate student with some of the luminaries in the field, used statistics, and helped people with statistics; but it wasn’t until I began teaching the subject that I really thought about the logical basis of the subject. Trying to explain to students why we were doing what we were doing forced me to explain it to myself. And, I wasn’t happy with some of those explanations. So, I began looking more deeply into the logic of statistical inference. Influenced strongly by the writings of Ian Hacking, Richard Royall, and especially the geneticist A.W.F. Edwards, I’ve come to adopt a version of the likelihood approach. The likelihood approach takes it that the goal of statistical inference is the same as that of scientific inference, and that the operationalization of this goal is to treat our observations as data bearing upon the adequacy of our theories. Not all approaches to statistical inference share this goal. Some are more modest, and some are more ambitious.

The more modest approach to statistical inference is that of Jerzy Neyman and Egon Pearson. In the Neyman-Pearson approach, one is concerned to adopt rules of behavior that minimize one’s mistakes. For example, buying a mega-pack of paper towels at Sam’s Club, and then finding that they are of unacceptably low quality, would be a mistake. They define two sorts of errors that might occur in making decisions, and see statistics as a way of reducing one’s decision making error rates. Although they, and especially, Neyman, made some quite grandiose claims for their views, the whole approach seems rather despairing to me: having given up on any attempt to obtain knowledge about the world, they settle for a clean, well-lighted place, or at least one in which the light bulbs usually work. While their approach makes perfect sense in the context of industrial quality control, it is not a suitable basis for scientific inference (which, indeed, Neyman thought was not possible).

The approach of R.A. Fisher, founder of modern statistics and evolutionary theory, shares with the likelihood approach the goal of treating our observations as data bearing upon the adequacy of our theories, and the two approaches also share many statistical procedures, but differ most notably on the issue of significance testing (i.e., those “p” values you often see in scientific papers, or commentaries upon them). What is actually taught and practiced by most scientists today is a hodge-podge of the Neyman-Pearson and Fisherian approaches. Much of the language and theory of Neyman-Pearson is used (e.g., types of errors), but, since few or no scientists actually want to do what Neyman and Pearson wanted to do, current statistical practice is suffused with an evidential interpretation quite congenial to Fisher, but foreign to the Neyman-Pearson approach.

Bayesianism, like the Fisherian and likelihood approaches, also sees our observations as data bearing upon the adequacy of our theories, but is more ambitious in wanting to have a formal, quantitative method for integrating what we learn from observation with everything else we know or believe, in order to come up with a single numerical measure of rational belief in propositions.

So, what is Bayesianism?

The Rev. Thomas Bayes was an 18th century English Nonconformist minister. His “An Essay Towards Solving a Problem in the Doctrine of Chances” was published in 1763, two years after his death. In the Essay, Bayes proved the famous theorem that now bears his name. The theorem is a useful, important, and nonproblematic result in probability theory. In modern notation, it states

P(H∣D) = [P(D∣H)⋅P(H)]/P(D).

In words, the probability P of an hypothesis H in the light of data D is equal to the probability of the data if the hypothesis were true (called the hypothesis’s likelihood) times the probability of the hypothesis prior to obtaining data D, with the product divided by the unconditional probability of the data (for any given problem, this would be a constant). Ignoring the constant in the denominator, P(D), we can say that the posterior probability, P(H∣D), (the probability of the hypothesis after we see the data), is proportional to the likelihood of the hypothesis in light of the data, P(D∣H), (the probability of the data if the hypothesis were true), times the prior probability, P(H), (the probability we gave to the hypothesis before we saw the data).

The theorem has many uncontroversial applications in fields such as genetics and medical diagnosis. These applications may be thought of as two-stage experiments, in which an initial experiment (or background set of observations) establishes probabilities for each of a set of exhaustive and mutually exclusive hypotheses, while the results of a second experiment (or set of observations), providing data D, are used to reevaluate the probabilities of the hypotheses. Thus, knowing something about the grandparents of a set of offspring may influence my evaluation of genetic hypotheses concerning the offspring. Or, in making a diagnosis, I may include in my calculations the known prevalence of a disease in the population, as well as the test results on a particular patient. For example, suppose a 95% accurate test for disease X is positive (+) for a patient, and the disease X is known to occur in 1% of the population. Then, by Bayes’ Theorem

P(X∣+) = P(+∣X)⋅P(X)/P(+)

= (.95)(.01)/[(.95)(.01)+(.05)(.99)]

= .16.

The probability that the patient has the disease is thus 16%. Note that despite the positive result on a pretty accurate test, the odds are more than four to one against the patient actually having condition X. This is because, since the disease is quite rare, most of the positive tests are false positives. [JAC: This is a common and counterintuitive result that could be of practical use to those of you who get a positive test. Such tests almost always mandate re-testing!]

So what could be controversial? Well, what if there is no first stage experiment or background knowledge which gives a probability distribution to the hypotheses? Bayes proposed what is known as Bayes’ Postulate: in the absence of prior information, each of the specifiable hypotheses should be accorded equal probability, or, for a continuum of hypotheses, a uniform distribution of probabilities. Bayes’ Postulate is an attempt to specify a probability distribution for ignorance. Thus, if I am studying the relative frequency of some event (which must range from 0 to 1), Bayes’ Postulate says I should assign a probability of .5 to the hypothesis that the event has a frequency greater than .5, and that the hypothesis that the frequency of the event falls between .25 and .40 should be given a probability of .15, and so on. But is Bayes’ Postulate a good idea?

Problems with Bayes’ Postulate

Let’s look at simple genetic example: a gene with two alleles (forms) at the locus (say alleles A and a). The two alleles have frequencies p + q = 1, and, if there are no evolutionary forces acting on the population and mating is at random, then the three genotypes (AA, Aa, and aa) will have the frequencies p², 2pq and q², respectively. If I am addressing the frequency of allele a, and I am a Bayesian, then I assign equal prior probability to all possible values of q, so

P(q>.5) = .5

But this implies that the frequency of the aa genotype has a non-uniform prior probability distribution

P(q²>.25) = .5.

My ignorance concerning q has become rather definite knowledge concerning q² (which, if there is genetic dominance at the locus, would be the frequency of recessive homozygotes; as in Mendel’s short pea plants, this is a very common way in which we observe the data). This apparent conversion of ‘ignorance’ to ‘knowledge’ will be generally so: prior probabilities are not invariant to parameter transformation (in this case, the transformation is the squaring of q). And even more generally, there will be no unique, objective distribution for ignorance. Lacking a genuine prior distribution (which we do have in the diagnosis example above), reasonable men may disagree on how to represent their ignorance. As Royall (1997) put it, “pure ignorance cannot be represented by a probability distribution”.

Bayesian inference

Bayesians proceed by using Bayes’ Postulate as a starting point, and then update their beliefs by using Bayes’ Theorem:

Posterior probability ∝ Likelihood × Prior probability

which can also be given as

Posterior opinion ∝ Likelihood × Prior opinion.

The appeal of Bayesianism is that it provides an all-encompassing, quantitative method for assessing the rational degree of belief in hypotheses. But there is still the problem of prior probabilities: what should we pick as our prior probabilities if there is no first-stage set of data to give us such a probability? Bayes’ Postulate doesn’t solve the problem, because there is no unique measure of ignorance. We must choose some prior probability distribution in order to carry out the Bayesian calculation, but you may choose a different distribution from the one I do, and neither is ‘correct’: the choice is subjective.

There are three ways round the problem of prior distributions. First, try really hard to find an objective way of portraying ignorance. This hasn’t worked yet, but some people are still trying. Second, note that the prior probabilities make little difference to the posterior probabilty as more and more data accumulate (i.e. as more experiments/observations provide more likelihoods), viz.

P(posterior) ∝ P(prior) × Likelihood  × Likelihood × Likelihood × . . .

In the end, only the likelihoods make a difference; but this is less a defense of Bayesianism than a surrender to likelihood. Third, boldly embrace subjectivity. But then, since everyone has their own prior, the only thing we can agree upon are the likelihoods.  So, why not just use the likelihoods?

The problem with Bayesianism is that it asks the wrong question. It asks, ‘How should I modify my current beliefs in the light of the data?’, rather than ‘Which hypotheses are best supported by the data?’. Bayesianism tells me (and me alone) what to believe, while likelihood tells us (all of us) what the data say.

*Apologies to Clark Glymour and Bertrand Russell.


Further Reading

The best and easiest place to start is with Sober and Royall.

Edwards, A.W.F. 1992. Likelihood. Expanded edition. Johns Hopkins University Press, Baltimore. An at times terse, but frequently witty, book that rewards careful study. In many ways, the founding document of likelihood inference; to paraphrase Darwin, it is ‘origin all my views’.

Gigerenzer, G., et al. 1989. The Empire of Chance. Cambridge University Press, Cambridge. A history of probability and statistics, including how the incompatible approaches of Fisher and Neyman-Pearson became hybridized into textbook orthodoxy.

Hacking, I. 1965. The Logic of Statistical Inference. Cambridge University Press, Cambridge. Hacking’s argument for likelihood as the fundamental concept for inference; he later changed his mind.

Hacking, I. 2001. An Introduction to Probability and Inductive Logic. Cambridge University Press, Cambridge. A well-written introductory textbook reflecting Hacking’s now more eclectic, and specifically Bayesian, views.

Royall, R. 1997. Statistical Evidence: a Likelihood Paradigm. Chapman & Hall, London. A very clear exposition of the likelihood approach, requiring little mathematical expertise. Along with Edwards, the key work in likelihood inference.

Sober, E. 2002. Bayesianism– Its Scope and Limits. Pp. 21-38 in R. Swinburne, ed., Bayes’ Theorem. Proceedings of the British Academy Press, vol. 113. An examination of the limits of both Bayesian and likelihood approaches. pdf (read this first!)

Psychology journal deep-sixes use of “p” values

March 5, 2015 • 8:45 am

Reader Ed Kroc sent an email about a strange development in scientific publishing—the complete elimination of “p” (probability) values in a big psychology journal. If you’re not a scientist or statistician, you may want to skip this post, but I think it’s important, and perhaps the harbinger of a bad trend in the field.

Before I present Ed’s email in its entirety, let me say a word (actually a lot of words) about “p values.”  These probabilities derive from experimental or observational tests of a “null hypothesis”— i.e., that an experimental treatment does not have an effect, or that two sample populations do not differ in some way. For example, suppose I want to see if rearing flies on different foods, say cornmeal versus yeast, affects their mating behavior.  The null hypothesis is that there is no effect on mating behavior. I then observe the behavior of 50 pairs of flies raised on each food, and find that 45 pair of the cornmeal flies mate within an hour, but only 37 pair of the yeast flies.

That looks different, but is it really? Suppose both kinds of flies really have equal propensities of mating, and the difference we see is just “sampling error”—something that could be due to chance alone. After all, if we toss a coin 10 times, and repeat that twice, perhaps the first time we’ll see 7 heads and the second time only 4. That is surely due to chance, because we’re using the same coin. Could that be the case for the flies?

It turns out that one can use statistics to calculate how often we’d see a given difference (due to sampling error) if the two populations were really the same. What we get is a “p” value: the probability that we’d see the difference we observed if the populations were really the same. The higher the p value, the more confidence we have that the populations really do not differ, and we’re seeing a sampling error. For example, if the p value were 0.8, that means there’s an 80% probability of getting the observed difference—or one that’s larger—by chance alone if the populations were the same. In that case we can’t have much confidence that the observed difference is a real one, and so we accept the null hypothesis and reject the “alternative hypothesis”—in our case that the kind of food experienced by a fly really does affect its behavior. But when a p value is small, say 0.01 (a 1% chance that we’d see a difference that big or bigger resulting from chance alone), we can have more confidence that there really is a difference between the sampled populations.

There’s a convention in biology that when the p value is lower than 5% (0.05), meaning that an observed difference that big or bigger would occur less than 5% of the time if the populations really were the same, we consider it statistically significant. That means that you’re entitled by convention to say that the populations really are different—and thus can publish a paper saying so. In the case above, the p value is 0.07, which is above the threshold, and so I couldn’t say in a paper that the differences were significant (remember, we mean statistically significant, not biologically significant).  There are various statistical tests one can use to compare samples to each other (you can do this not just with two samples but with multiple ones), and most of these take into account not just the average values or observed numbers, but also, in the case of measurements, the variation among individuals. In the test of two fly samples above, I used the “chi-square” test to get the probabilities.

Of course even if your samples are really from the same population, and there’s no effect, you’ll still see a “significant” difference 5% of the time even if it just reflects sampling error, so you can draw incorrect conclusions from the statistic.  That gave rise to the old maxim in biology, “You can do 20 experiments, and one will be publishable in Nature.” And of course one out of twenty papers you read that report p < 0.05 will be rejecting the null hypothesis (of no difference) erroneously.

I should note that the cut-off probabilities differ among fields. Physicists are more rigorous, and only accept p values of much less than 0.001 as significant (as they did when detecting the Higgs boson). In psychology some journals are more lax, accepting cut-off p’s of 0.1 (10%) or less. All of these numbers are of course arbitrary conventions, and some have suggested that we don’t use cut-off values to determine whether a result is “real”, but simply present that probabilities and let the reader judge for herself. I don’t disagree with that. But, according to statistician Ed Kroc, one journal has gone farther, suggesting that we don’t report p values at all! I think that’s a mistake, for then one has no way to judge how likely it is that your null hypothesis is wrong. Ed agrees, and reports the situation below:

*******

by Ed Kroc

I wanted to pass this along in case no one else has yet, as it could be of interest to you, as well as to anyone who has the occasion to use statistics. Apparently, the psychology journal Basic and Applied Social Psychology just banned the use of null hypothesis significance testing; see the editorial here.

As a statistician myself, I naturally have a lot to say about such a move, but I’ll limit myself to a few key points.

First, this type of action really underlines how little many people understand common statistical procedures and concepts, even those who use them on a regular basis and presumably have some minimal level of training in said usage. I appreciate the editors trying to address the very real problem of seeing statistical decision making reduced to checking whether or not a p-value crosses an arbitrary threshold, but their approach of banning the use of p-values and their closest kin just proves that they don’t fully understand the problem they are trying to address. p-values are not the problem. Misuse and misinterpretation of what p-values mean are the real problems, as is the insistence by most editorial boards that publishable applied research must include these quantities calculated to within a certain arbitrary range.

The manipulation of data and methods by researchers to attain an arbitrary 0.05 cutoff, the effective elimination of negative results by only
publishing results deemed “statistically significant”, the lack of modelling, and the lack of proper statistical decision making are all real problems within applied science today. Banning the usage of (frequentist) inferential methods does nothing to address these things. It’s like saying not enough people understand fractions, so we’re just going to get rid of division to address the problem.

Alarmingly, the editors say “the null hypothesis testing procedure is invalid”. What? No caveats? That’s news to me. Invalid under what rubric? They never say.

Interestingly, they no longer require any inferential statistics to appear in an article. I don’t actually categorically disagree with that policy—in fact, I think some research could be improved by including fewer inferential procedures—but their justification for it is ludicrous: “because the state of the art remains uncertain”. Well, then we should all stop doing any kind of science I guess. Who is practicing the
state of the art anywhere? And who gets to decide what is or is not state of the art?

Finally, the editors say this:

“BASP will require strong descriptive statistics, including effects sizes. We also encourage the presentation of frequency or distributional data when this is feasible. Finally, we encourage the use of larger sample sizes. . . because as the sample size increases, descriptive statistics become increasingly stable and sampling error less of a problem.”

First off, no, as sample size increases, sampling error does not necessarily become less of a problem: that’s true only if your sampling procedure is perfectly correct to begin with, something that is likely never to be the case in an experimental psychology setting. More importantly, they basically admit here that they only want to see descriptive statistics [means, variances, etc.] and they don’t need to know any statistics the discipline doesn’t understand. Effect sizes and frequency distributions? p-values are still sitting behind all of those, whether they’re calculated or not; they are just comparative measures of these things accounting for uncertainty. The editors seem to be replacing the p-value measure with the “eyeball measure”, effectively removing any quantification of the uncertainty in the experiments or random processes under consideration. A bit misguided, in my opinion.

I could go on—in particular, about their comments on Bayesian methods—but I’ll spare you any more of my own editorializing. Part of me wonders if this move is a bit of a publicity stunt for the journal. I know nothing about psychology journals or how popular this one is, but it seems like this type of move would certainly generate a lot of attention. I do hope though that other journals will not follow suit.